Answered step by step
Verified Expert Solution
Question
1 Approved Answer
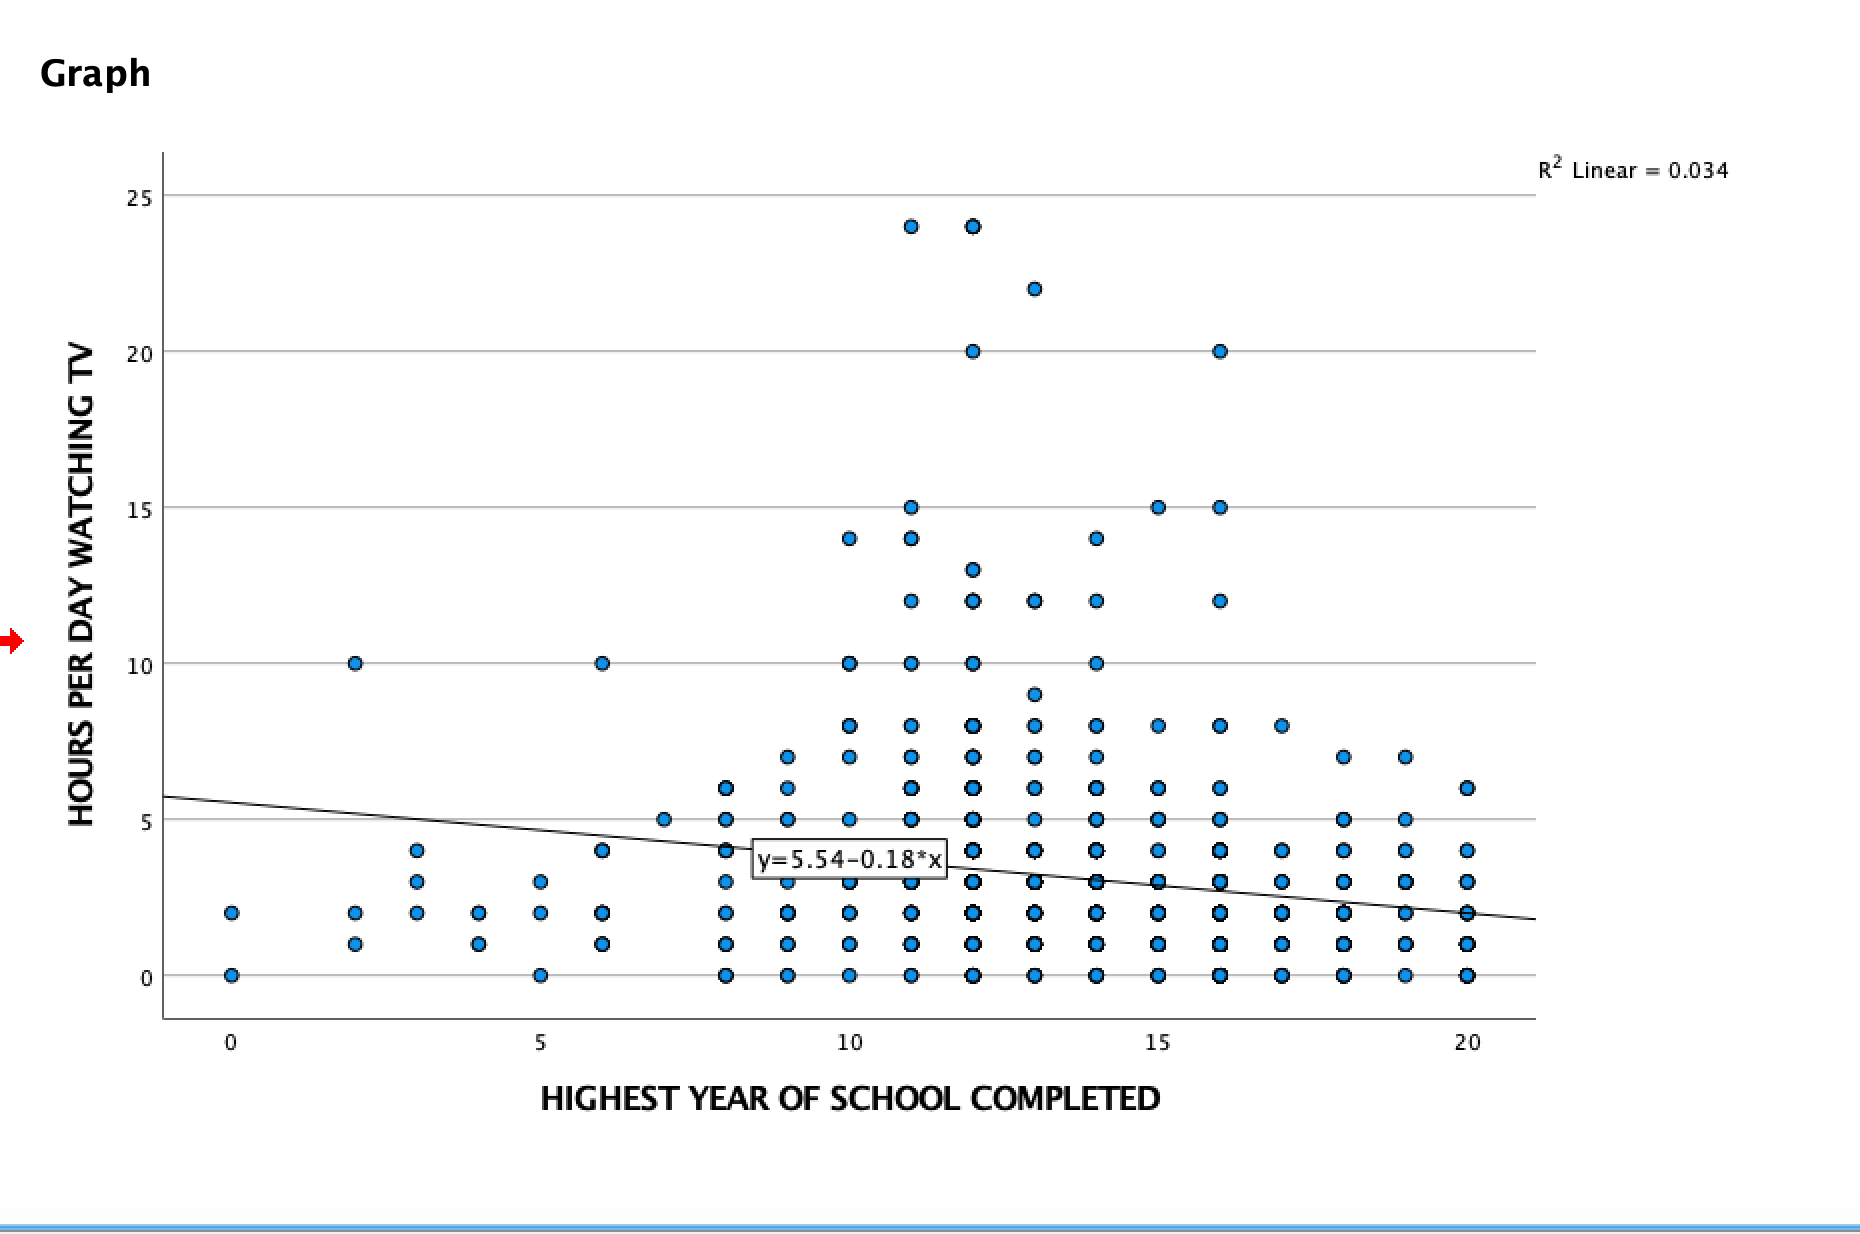
Produce a scatterplot with a regression line for the variables EDUC [independent] and TVHOURS [dependent]. What is the direction of the relationship between the variables?
Produce a scatterplot with a regression line for the variables EDUC [independent] and TVHOURS [dependent].
- What is the direction of the relationship between the variables? ______________ As years of education increases, does the number of hours of television watched increase or decrease?
- The relationship of the "dots" or cases to the regression line suggests what about the strengths of the relationship between these two variables?

Step by Step Solution
There are 3 Steps involved in it
Step: 1

Get Instant Access to Expert-Tailored Solutions
See step-by-step solutions with expert insights and AI powered tools for academic success
Step: 2

Step: 3

Ace Your Homework with AI
Get the answers you need in no time with our AI-driven, step-by-step assistance
Get Started


