Answered step by step
Verified Expert Solution
Question
1 Approved Answer
Assignment 2 1- [Consumer Behavior] 30 points - 10 points each part Notes: Draw Separate Graphs for Each Part We are interested in the

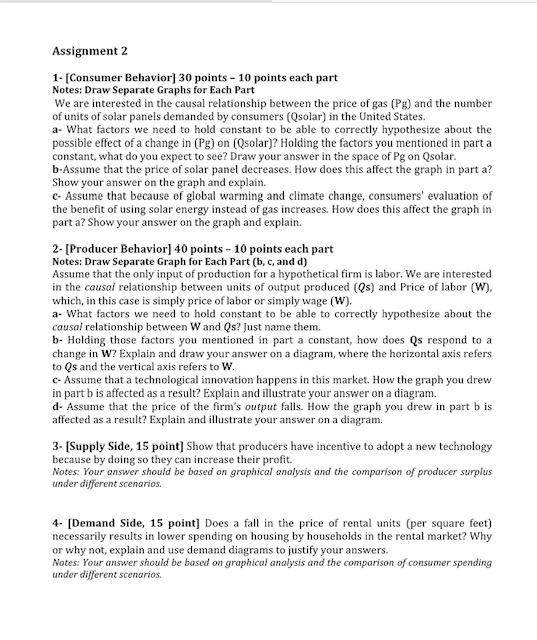
Assignment 2 1- [Consumer Behavior] 30 points - 10 points each part Notes: Draw Separate Graphs for Each Part We are interested in the causal relationship between the price of gas (Pg) and the number of units of solar panels demanded by consumers (Qsolar) in the United States. a- What factors we need to hold constant to be able to correctly hypothesize about the possible effect of a change in (Pg) on (Qsolar)? Holding the factors you mentioned in part a constant, what do you expect to see? Draw your answer in the space of Pg on Qsolar. b-Assume that the price of solar panel decreases. How does this affect the graph in part a? Show your answer on the graph and explain. c- Assume that because of global warming and climate change, consumers' evaluation of the benefit of using solar energy instead of gas increases. How does this affect the graph in part a? Show your answer on the graph and explain. 2- [Producer Behavior] 40 points - 10 points each part Notes: Draw Separate Graph for Each Part (b, c, and d) Assume that the only input of production for a hypothetical firm is labor. We are interested in the causal relationship between units of output produced (Qs) and Price of labor (W), which, in this case is simply price of labor or simply wage (W). a- What factors we need to hold constant to be able to correctly hypothesize about the causal relationship between W and Qs? Just name them. b- Holding those factors you mentioned in part a constant, how does Qs respond to a change in W? Explain and draw your answer on a diagram, where the horizontal axis refers to Qs and the vertical axis refers to W. c- Assume that a technological innovation happens in this market. How the graph you drew in part b is affected as a result? Explain and illustrate your answer on a diagram. d- Assume that the price of the firm's output falls. How the graph you drew in part b is affected as a result? Explain and illustrate your answer on a diagram. 3- [Supply Side, 15 point] Show that producers have incentive to adopt a new technology because by doing so they can increase their profit. Notes: Your answer should be based on graphical analysis and the comparison of producer surplus under different scenarios. 4- [Demand Side, 15 point] Does a fall in the price of rental units (per square feet) necessarily results in lower spending on housing by households in the rental market? Why or why not, explain and use demand diagrams to justify your answers. Notes: Your answer should be based on graphical analysis and the comparison of consumer spending under different scenarios.
Step by Step Solution
★★★★★
3.45 Rating (158 Votes )
There are 3 Steps involved in it
Step: 1
1 A In order to correctly capture the effect of change in price on quantity demanded of a ...
Get Instant Access to Expert-Tailored Solutions
See step-by-step solutions with expert insights and AI powered tools for academic success
Step: 2

Step: 3

Ace Your Homework with AI
Get the answers you need in no time with our AI-driven, step-by-step assistance
Get Started


