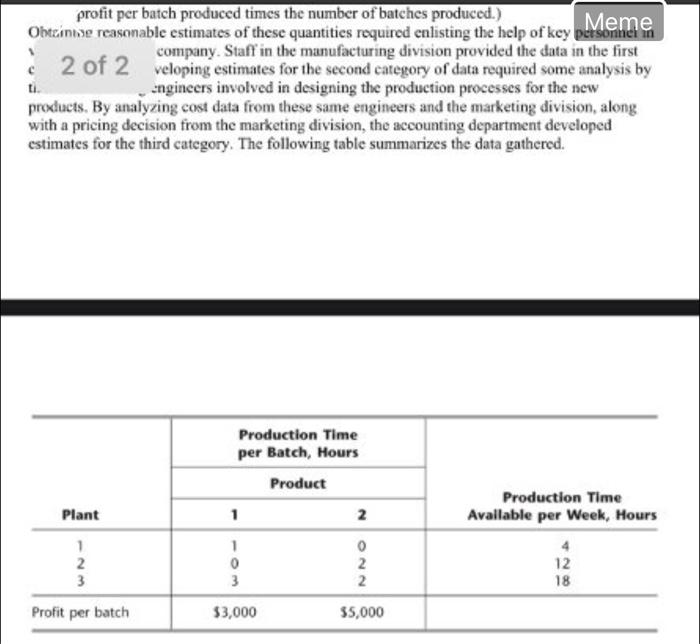
Product Mix for Braj Braj CO produces high-quality glass products, including windows and glass doors. It has three plants. Aluminum frames and hardware are made in Plant I, wood frames are made in Plant 2. and Plant 3 produces the glass and assembles the products. Because of declining earnings, top management has decided to revamp the company's product line. Unprofitable products are being discontinued, releasing production capacity to launch two new products having large sales potential: Product 1: An 8-foot glass door with aluminum framing Product 2: A 4*6 foot double-hung wood-framed window Product I requires some of the production capacity in Plants 1 and 3, but none in Plant 2. Product 2 needs only Plants 2 and 3. The marketing division has concluded that the company could sell as much of either product as could be produced by these plants. However, because both products would be competing for the same production capacity in Plant 3, it is not clear which mix of the two products would be most profitable. Therefore, your OM team has been formed to study this question. Your team began by having discussions with upper management to identify management's objectives for the study. These discussions led to developing the following definition of the problem: Determine what the production rates should be for the two products in order to maximize their total profit , subject to the restrictions imposed by the limited production capacities available in the three plants. (Each product will be produced in batches of 20, so the production rate is defined as the number of batches produced per week.) Any combination of production rates that satisfies these restrictions is permitted, including producing none of one product and as much as possible of the other Your team also identified the data that needed to be gathered: 1. Number of hours of production time available per week in cach plant for these new products. (Most of the time in these plants already is committed to current products, so the available capacity for the new products is quite limited.) 2. Number of hours of production time used in cach plant for each batch produced of each new product 3. Protit per batch produced of each new product. (Profit per batch produced was chosen as an appropriate measure after the team concluded that the incremental profit from each additional batch produced would be roughly constant regardless of the total number of batches produced. Because no substantial costs will be incurred to initiate the production and marketing of these new products, the total profit from each one is approximately this profit per batch produced times the number of batches produced.) Obtaining reasonable estimates of these quantities required enlisting the help of key personnel in various units of the company. Staff in the manufacturing division provided the data in the first category above. Developing estimates for the second category of data required some analysis by the manufacturing engineers involved in designing the production processes for the new products. By analyzing cost data from these same engineers and the marketing division, along with a pricing decision from the marketing division, the accounting department developed estimates for the third category. The following table summarizes the data gathered. profit per batch produced times the number of batches produced.) Meme Obtine reasonable estimates of these quantities required enlisting the help of key petsorinel In company. Staff in the manufacturing division provided the data in the first 2 of 2 veloping estimates for the second category of data required some analysis by ti -ngineers involved in designing the production processes for the new products. By analyzing cost data from these same engineers and the marketing division, along with a pricing decision from the marketing division, the accounting department developed estimates for the third category. The following table summarizes the data gathered. Production Time per Batch, Hours Product 1 2 Plant Production Time Available per Week, Hours 4 1 2 3 1 0 3 ONN 12 2 2 18 Profit per batch $3,000 $5,000 addressing the following: a. What are the key elements in the problem: output(s)objective(s), decision variable(s), input parameters and constraints? b. What are the key relationships in the problem? c. Construct an influence chart for the