Answered step by step
Verified Expert Solution
Link Copied!

Question

1 Approved Answer

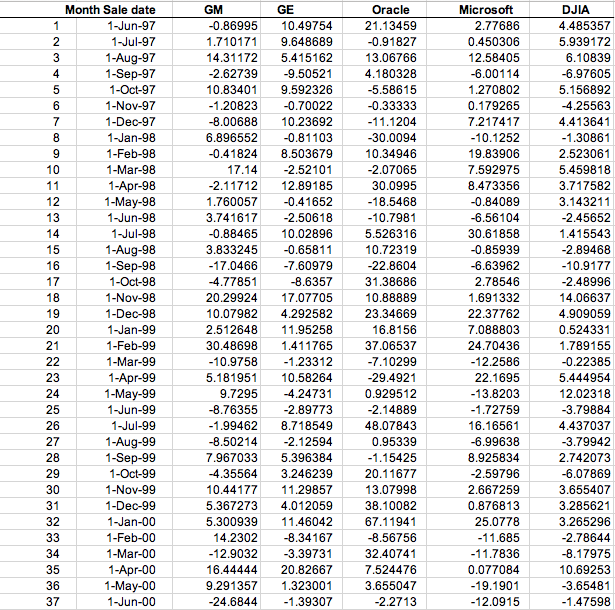
Professors Portfolio Case Synopsis: Rob McGowan collects data from General Motors, General Electric, Oracle, and Microsoft. His professor seeks to form a portfolio using these

Professors Portfolio Case

Synopsis: Rob McGowan collects data from General Motors, General Electric, Oracle, and Microsoft. His professor seeks to form a portfolio using these stocks.

Assignment: Provide a quick rundown of the issues that the professor face while creating his portfolio. Discuss what your goals and objective would be if you were creating this portfolio, how can you add value. Think about issues such as efficiency, risk-return, and how to add value. Include a recommendation of a portfolio make-up (weights, or even suggestions of other stocks).

1. Estimate and compare the monthly returns and variability (standard deviation) of each stock with that of the DJIA Index.

a. Which stock appears to be riskiest? Less risky?

b. How might the expected return of each stock relate to its riskiness?

2. Suppose the professor decides to make the portfolio with equal weight of stock holding (each stock holds 25% weight in the portfolio). Estimate the resulting portfolio position.

a. How does each stock affect the variability of the equity investment? What is the risk and return of the portfolio?

b. What is the correlation between the stocks? How do you think the stocks effect the portfolios risk and return?

c. How does this relate to your answer in question 1 above?

3. Compute the beta for each stock (Use DJIA as the market return).

a. What does beta measure?

b. How does this relate to your previous answers?

4. What is the required rate of return for each stock (CAPM)? Explain the number and put it into context? (Use the RF rate given in the second page)

5. Make a recommendation of what you would do if you were professor. Would you try something different?

a. What would be your main objective?

b. How would you weigh each stock in the portfolio? Why? What would be the resulting risk and return?

Monthly Risk-Free rate (in percentages)

1997-06-01

0.93%

1997-07-01

1.05%

1997-08-01

1.14%

1997-09-01

0.95%

1997-10-01

0.97%

1997-11-01

1.14%

1997-12-01

1.16%

1998-01-01

1.04%

1998-02-01

1.09%

1998-03-01

1.03%

1998-04-01

0.95%

1998-05-01

1%

1998-06-01

0.98%

1998-07-01

0.96%

1998-08-01

0.90%

1998-09-01

0.61%

1998-10-01

0.96%

1998-11-01

0.41%

1998-12-01

0.39%

1999-01-01

0.34%

1999-02-01

0.44%

1999-03-01

0.44%

1999-04-01

0.29%

1999-05-01

0.50%

1999-06-01

0.57%

1999-07-01

0.55%

1999-08-01

0.72%

1999-09-01

0.68%

1999-10-01

0.86%

1999-11-01

1.07%

1999-12-01

1.20%

2000-01-01

1.32%

2000-02-01

1.55%

2000-03-01

1.69%

2000-04-01

1.66%

2000-05-01

1.79%

2000-06-01

1.69%

image text in transcribed

Month Sale date Microsoft 2.77686 0.450306 12.58405 0.86995 10.49754 1.710171 9.648689 14.31172 5.415162 2.62739 9.50521 10.83401 9.592326 1.208230.70022 8.00688 10.23692 6.896552 0.81103 0.41824 8.503679 -2.52101 2.11712 12.89185 1.7600570.41652 3.741617-2.50618 0.88465 10.02896 3.833245 0.65811 17.04667.60979 8.6357 20.29924 17.07705 10.07982 4.292582 2.512648 11.95258 30.48698 1.411765 10.97581.23312 5.181951 10.58264 9.72954.24731 8.76355 2.89773 1.99462 8.718549 8.502142.12594 7.967033 5.396384 -4.35564 3.246239 10.44177 11.29857 5.367273 4.012059 5.300939 11.46042 14.23028.34167 12.9032 3.39731 16.44444 20.82667 9.291357 1.323001 24.68441.39307 0.91827 13.06766 4.180328 -5.58615 0.33333 -11.1204 30.0094 10.34946 -2.07065 4.485357 5.939172 6.10839 6.97605 5.156892 4.25563 4.413641 1.30861 2.523061 5.459818 3.717582 143211 1-Aug-97 1-Sep-97 1.270802 0.179265 1-Nov-97 1-Dec-97 10.1252 19.83906 7.592975 8.473356 0.84089 6.56104 10.7981 5.526316 1-Jun-98 1.415543 2.89468 1-Aug-98 1-Sep-98 6.63962 2.78546 1.691332 22.37762 7.088803 24.70436 12.2586 2.1695 13.8203 1.72759 22.8604 31.38686 10.88889 23.34669 2.48996 14.06637 4.909059 0.524331 1.789155 0.22385 5.444954 12.02318 3.79884 4.437037 3.79942 2.742073 6.07869 3.655407 3.285621 3.265296 1-Nov-98 1-Dec-98 37.06537 7.10299 29.4921 0.929512 2.14889 48.07843 0.95339 1-Jun-99 1-Aug-99 1-Sep-99 6.99638 8.925834 -2.59796 2.667259 0.876813 25.0778 30 1-Nov-99 1-Dec-99 13.07998 38.10082 67.11941 8.56756 2.78644 -11.7836 0.077084 8.17975 10.69253 32.40741 7.524476 3.655047 -2.2713 1-Jun-00 1.47598 Month Sale date Microsoft 2.77686 0.450306 12.58405 0.86995 10.49754 1.710171 9.648689 14.31172 5.415162 2.62739 9.50521 10.83401 9.592326 1.208230.70022 8.00688 10.23692 6.896552 0.81103 0.41824 8.503679 -2.52101 2.11712 12.89185 1.7600570.41652 3.741617-2.50618 0.88465 10.02896 3.833245 0.65811 17.04667.60979 8.6357 20.29924 17.07705 10.07982 4.292582 2.512648 11.95258 30.48698 1.411765 10.97581.23312 5.181951 10.58264 9.72954.24731 8.76355 2.89773 1.99462 8.718549 8.502142.12594 7.967033 5.396384 -4.35564 3.246239 10.44177 11.29857 5.367273 4.012059 5.300939 11.46042 14.23028.34167 12.9032 3.39731 16.44444 20.82667 9.291357 1.323001 24.68441.39307 0.91827 13.06766 4.180328 -5.58615 0.33333 -11.1204 30.0094 10.34946 -2.07065 4.485357 5.939172 6.10839 6.97605 5.156892 4.25563 4.413641 1.30861 2.523061 5.459818 3.717582 143211 1-Aug-97 1-Sep-97 1.270802 0.179265 1-Nov-97 1-Dec-97 10.1252 19.83906 7.592975 8.473356 0.84089 6.56104 10.7981 5.526316 1-Jun-98 1.415543 2.89468 1-Aug-98 1-Sep-98 6.63962 2.78546 1.691332 22.37762 7.088803 24.70436 12.2586 2.1695 13.8203 1.72759 22.8604 31.38686 10.88889 23.34669 2.48996 14.06637 4.909059 0.524331 1.789155 0.22385 5.444954 12.02318 3.79884 4.437037 3.79942 2.742073 6.07869 3.655407 3.285621 3.265296 1-Nov-98 1-Dec-98 37.06537 7.10299 29.4921 0.929512 2.14889 48.07843 0.95339 1-Jun-99 1-Aug-99 1-Sep-99 6.99638 8.925834 -2.59796 2.667259 0.876813 25.0778 30 1-Nov-99 1-Dec-99 13.07998 38.10082 67.11941 8.56756 2.78644 -11.7836 0.077084 8.17975 10.69253 32.40741 7.524476 3.655047 -2.2713 1-Jun-00 1.47598

Step by Step Solution

There are 3 Steps involved in it

Step: 1

blur-text-image

Get Instant Access to Expert-Tailored Solutions

See step-by-step solutions with expert insights and AI powered tools for academic success

Step: 2

blur-text-image

Step: 3

blur-text-image

Ace Your Homework with AI

Get the answers you need in no time with our AI-driven, step-by-step assistance

Get Started

Recommended Textbook for

Open Market Operations And Financial Markets

Authors: David Mayes , Jan Toporowski

1st Edition

0415417759, 978-0415417754

More Books

Students also viewed these Finance questions

Question

Compute the range, mean, median, and mode for the given data.

Answered: 1 week ago

Question

What are your three core personal values?

Answered: 1 week ago