Answered step by step
Verified Expert Solution
Question
1 Approved Answer
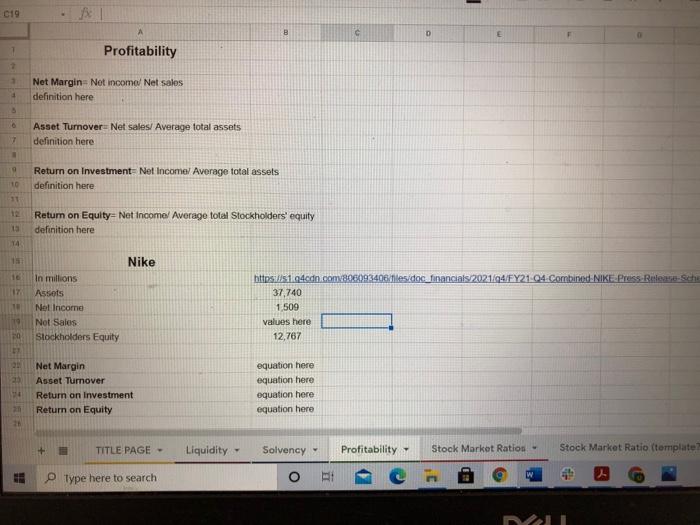
Profitability -Financial statement analysis. Enter the values for each corespondinf part 019 D E 7 Profitability 2 Net Margin-Not incomo/ Net sales definition here 4


Profitability -Financial statement analysis.
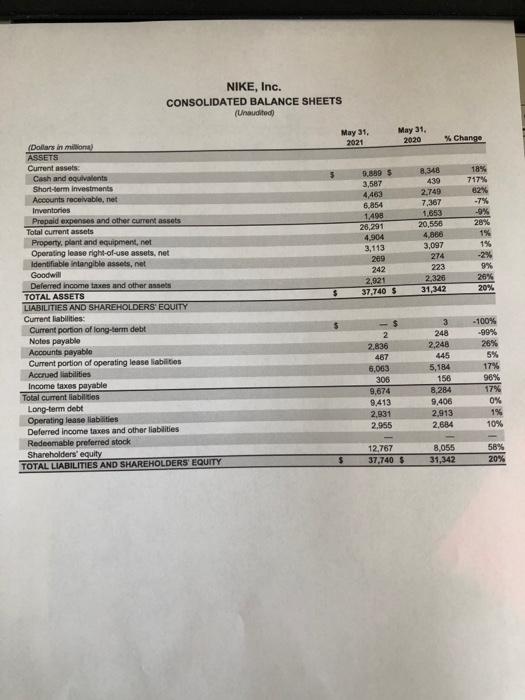
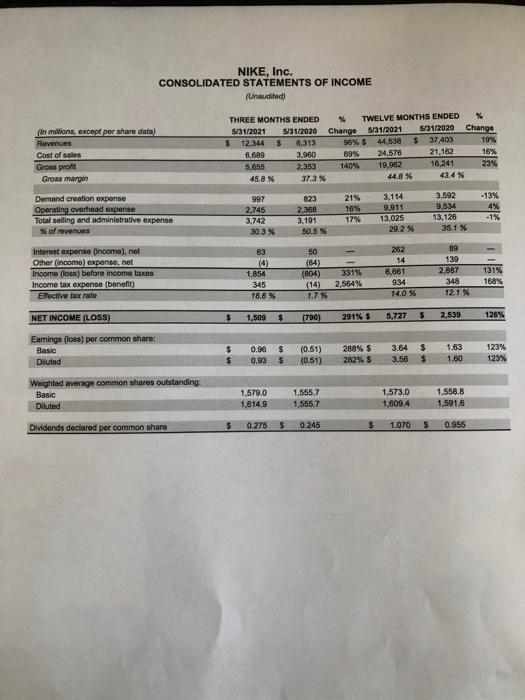
019 D E 7 Profitability 2 Net Margin-Not incomo/ Net sales definition here 4 Asset TurnoverNet sales/ Average total assets definition here 7 Return on Investment- Net Income Average total assets definition here 10 11 Retum on Equity- Net Incomel Average total Stockholders' equity definition here TA Nike 17 TE in millions Assets Not Income Not Sales Stockholders Equity https://s1.4cdn.com/806093406/tiles.doc financials 2021/24/FY21 04 Combined NIKE Press Release-sche 37,740 1,509 values here 12,767 20 Net Margin Asset Turnover Return on investment Return on Equity equation here equation here equation here equation here + TITLE PAGE - Liquidity - Solvency Profitability Stock Market Ration- Stock Market Ratio (template Type here to search o W NI NIKE, Inc. CONSOLIDATED BALANCE SHEETS (Unaudited May 31, 2021 May 31, 2020 % Change 9.889 3,587 4,463 6,854 1498 28, 291 4.904 3,113 8,348 439 2.749 7,367 1.653 20.556 4,068 3,097 274 223 2,326 31,342 18% 717% 82% -7% -9% 28% 1% 1% 242 2,921 37.740 $ 9% 26% 20% (Dollars in million ASSETS Current assets Cash and equivalents Short-term investments Accounts receivable, net Inventories Prepaid expenses and other current assets Total current assets Property, plant and equipment, net Operating lease right-of-use assets.net Identifiable intangible assets.net Goodwill Deferred Income taxes and other assets TOTAL ASSETS LIABILITIES AND SHAREHOLDERS' EQUITY Current liabilities: Current portion of long-term debit Noles payable Accounts payable Current portion of operating lesse liabilities Accrued liabilities Income taxes payable Total current liabilities Long-term debt Operating lease liabilities Deferred Income taxes and other liabilities Redeemable preferred stock Shareholders' equity TOTAL LIABILITIES AND SHAREHOLDERS' EQUITY - $ 2 2,836 467 5,063 306 9,674 9,413 2,931 2,955 3 248 2.248 445 5,184 156 8,284 9,406 2,913 2,684 -100% -99% 26% 5% 17% 98% 17% 0% 1% 10% 12,767 37,740 S 8,055 31,342 58% 20% NIKE, Inc. CONSOLIDATED STATEMENTS OF INCOME (Unaudited) in Millions, except per share data) Revenues Cost of sales Gross profil Gross margin THREE MONTHS ENDED TWELVE MONTHS ENDED % 5/31/2021 5/31/2020 Change 5/31/2021 5/31/2020 Change $ 12,344 5 0,313 96% $ 44,538 $ 37.403 19% 6,680 3.900 69% 24,576 21,162 16% 5.655 2.353 140% 19,902 16.241 23% 45.8 % 37.3% 44.8% 43.4 % Demand creation expense Operating overhead expense Total selling and administrative expense % of revenues 997 2.745 3,742 303 % B23 2.368 3.191 50.5 % 21% 16% 17% 3,114 9,011 13,025 29.2 % 3,592 9.534 13,126 35.1 % -13% 4% -1% - Interest expense (income), net Other (incomo) expense, net Income (los) before income taxes Income tax expense (benefit) Efective tax rate 63 (4) 1,854 345 78.6% 50 (84) (804) 331% (14) 2,564% 1.7% 262 14 6,661 934 14.0 % 89 139 2,657 348 12.1 % 131% 188% $ NET INCOME (LOSS) $ 1,509 (790) 291% $ $ 5,727 126% 2,530 Earnings (los) per common share Basic Diluted $ $ 0.96 0.93 $ $ (0.51) (0.51) 288% $ 282% $ 3.84 3.56 $ $ 1.63 1.50 123% 123% Weighted average common shares outstanding Basic Diluted 1,579,0 1,614.9 1,565.7 1.555.7 1,573.0 1.609.4 1,558.8 1,591.6 Dividends declared por common share $ 0.275 $ 0.245 $ 1.070 5 0.955 019 D E 7 Profitability 2 Net Margin-Not incomo/ Net sales definition here 4 Asset TurnoverNet sales/ Average total assets definition here 7 Return on Investment- Net Income Average total assets definition here 10 11 Retum on Equity- Net Incomel Average total Stockholders' equity definition here TA Nike 17 TE in millions Assets Not Income Not Sales Stockholders Equity https://s1.4cdn.com/806093406/tiles.doc financials 2021/24/FY21 04 Combined NIKE Press Release-sche 37,740 1,509 values here 12,767 20 Net Margin Asset Turnover Return on investment Return on Equity equation here equation here equation here equation here + TITLE PAGE - Liquidity - Solvency Profitability Stock Market Ration- Stock Market Ratio (template Type here to search o W NI NIKE, Inc. CONSOLIDATED BALANCE SHEETS (Unaudited May 31, 2021 May 31, 2020 % Change 9.889 3,587 4,463 6,854 1498 28, 291 4.904 3,113 8,348 439 2.749 7,367 1.653 20.556 4,068 3,097 274 223 2,326 31,342 18% 717% 82% -7% -9% 28% 1% 1% 242 2,921 37.740 $ 9% 26% 20% (Dollars in million ASSETS Current assets Cash and equivalents Short-term investments Accounts receivable, net Inventories Prepaid expenses and other current assets Total current assets Property, plant and equipment, net Operating lease right-of-use assets.net Identifiable intangible assets.net Goodwill Deferred Income taxes and other assets TOTAL ASSETS LIABILITIES AND SHAREHOLDERS' EQUITY Current liabilities: Current portion of long-term debit Noles payable Accounts payable Current portion of operating lesse liabilities Accrued liabilities Income taxes payable Total current liabilities Long-term debt Operating lease liabilities Deferred Income taxes and other liabilities Redeemable preferred stock Shareholders' equity TOTAL LIABILITIES AND SHAREHOLDERS' EQUITY - $ 2 2,836 467 5,063 306 9,674 9,413 2,931 2,955 3 248 2.248 445 5,184 156 8,284 9,406 2,913 2,684 -100% -99% 26% 5% 17% 98% 17% 0% 1% 10% 12,767 37,740 S 8,055 31,342 58% 20% NIKE, Inc. CONSOLIDATED STATEMENTS OF INCOME (Unaudited) in Millions, except per share data) Revenues Cost of sales Gross profil Gross margin THREE MONTHS ENDED TWELVE MONTHS ENDED % 5/31/2021 5/31/2020 Change 5/31/2021 5/31/2020 Change $ 12,344 5 0,313 96% $ 44,538 $ 37.403 19% 6,680 3.900 69% 24,576 21,162 16% 5.655 2.353 140% 19,902 16.241 23% 45.8 % 37.3% 44.8% 43.4 % Demand creation expense Operating overhead expense Total selling and administrative expense % of revenues 997 2.745 3,742 303 % B23 2.368 3.191 50.5 % 21% 16% 17% 3,114 9,011 13,025 29.2 % 3,592 9.534 13,126 35.1 % -13% 4% -1% - Interest expense (income), net Other (incomo) expense, net Income (los) before income taxes Income tax expense (benefit) Efective tax rate 63 (4) 1,854 345 78.6% 50 (84) (804) 331% (14) 2,564% 1.7% 262 14 6,661 934 14.0 % 89 139 2,657 348 12.1 % 131% 188% $ NET INCOME (LOSS) $ 1,509 (790) 291% $ $ 5,727 126% 2,530 Earnings (los) per common share Basic Diluted $ $ 0.96 0.93 $ $ (0.51) (0.51) 288% $ 282% $ 3.84 3.56 $ $ 1.63 1.50 123% 123% Weighted average common shares outstanding Basic Diluted 1,579,0 1,614.9 1,565.7 1.555.7 1,573.0 1.609.4 1,558.8 1,591.6 Dividends declared por common share $ 0.275 $ 0.245 $ 1.070 5 0.955 Enter the values for each corespondinf part
Step by Step Solution
There are 3 Steps involved in it
Step: 1

Get Instant Access to Expert-Tailored Solutions
See step-by-step solutions with expert insights and AI powered tools for academic success
Step: 2

Step: 3

Ace Your Homework with AI
Get the answers you need in no time with our AI-driven, step-by-step assistance
Get Started


