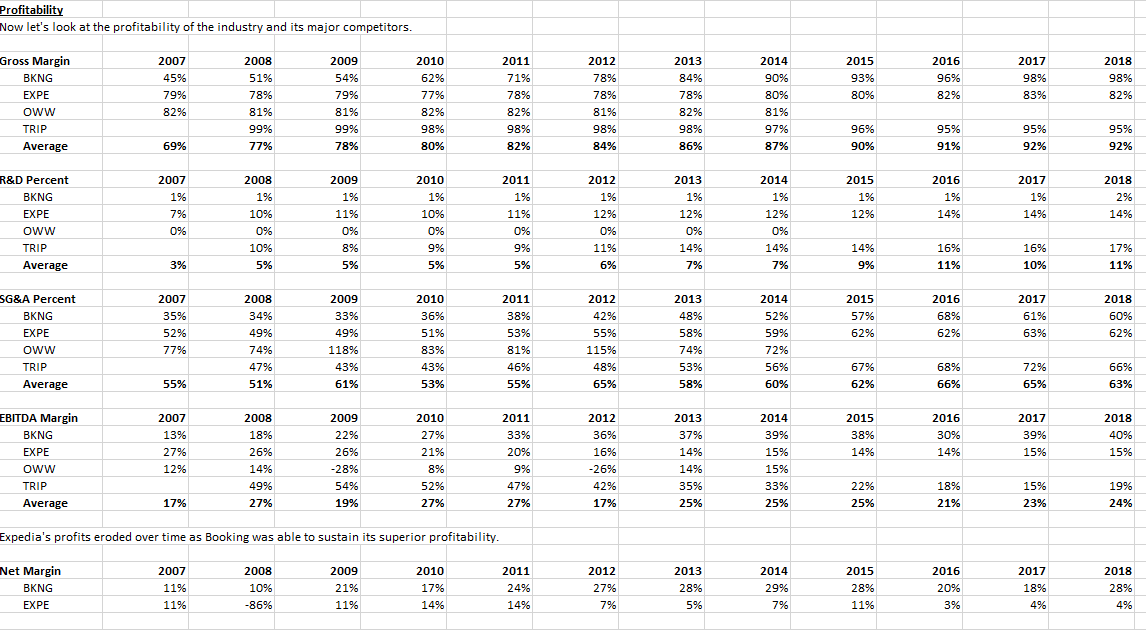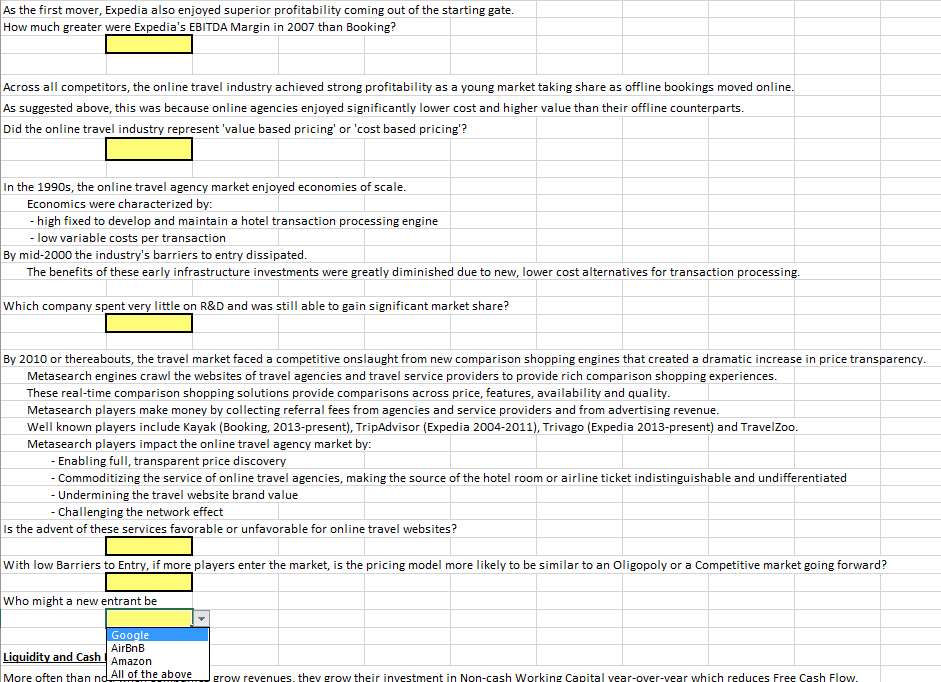

Profitability Now let's look at the profitability of the industry and its major competitors. 2007 45% 79% 82% 2008 51% 78% 81% 99% 2015 93% 80% Gross Margin BKNG EXPE oww TRIP Average 2016 96% 82% 2017 98% 83% 2012 78% 78% 81% 98% 2018 98% 82% 2009 54% 79% 81% 99% 78% 2010 62% 77% 82% 98% 80% 2011 71% 78% 82% 98% 82% 2013 849 78% 82% 98% 86% 2014 90% 80% 81% 97% 87% 96% 90% 95% 91% 95% 92% 95% 92% 69% 77% 84% 2008 1% R&D Percent BKNG EXPE Oww TRIP 2007 1% 7% 0% 2015 1% 12% 2016 1% 14% 2018 29 2017 1% 14% 14% 10% 0% 2009 1% 11% 09 8% 5% 2010 1% 10% 0% 9% 5% 2011 1% 11% 0% 9% 5% 2012 1% 12% 0% 11% 6% 2013 1% 12% 0% 14% 7% 2014 1% 12% 0% 14% 7% 16% 17% 10% 5% 14% 9% 16% 11% Average 3% 10% 11% 2007 35% 52% 77% 2015 57% 62% SG&A Percent BKNG EXPE Oww TRIP Average 2010 36% 51% 83% 43% 2016 68% 62% 2017 61% 63% 2008 34% 49% 74% 47% 51% 2018 60% 62% 2009 33% 49% 118% 43% 61% 2014 52% 59% 72% 2011 38% 53% 81% 46% 55% 2012 42% 55% 115% 48% 65% 2013 48% 58% 749 53% 58% 56% 60% 67% 62% 68% 66% 72% 65% 66% 63% 55% 53% 2007 13% 27% 12% 2015 38% 14% 2016 30% 14% 2017 39% 15% EBITDA Margin BKNG EXPE Oww TRIP Average 2018 40% 15% 2008 18% 26% 14% 49% 27% 2009 22% 26% -28% 54% 19% 2010 27% 21% 8% 52% 27% 2011 33% 20% 9% 47% 27% 2012 36% 16% -26% 42% 17% 2013 37% 14% 14% 35% 25% 2014 39% 15% 15% 33% 25% 22% 25% 18% 21% 15% 23% 19% 24% 17% Expedia's profits eroded over time as Booking was able to sustain its superior profitability Net Margin BKNG EXPE 2007 11% 11% 2008 10% -86% 2009 21% 11% 2010 17% 14% 2011 24% 14% 2012 27% 7% 2013 28% 5% 2014 29% 7% 2015 28% 11% 2016 20% 3% 2017 18% 4% 2018 28% 4% As the first mover, Expedia also enjoyed superior profitability coming out of the starting gate. How much greater were Expedia's EBITDA Margin in 2007 than Booking? Across all competitors, the online travel industry achieved strong profitability as a young market taking share as offline bookings moved online. As suggested above, this was because online agencies enjoyed significantly lower cost and higher value than their offline counterparts. Did the online travel industry represent 'value based pricing' or 'cost based pricing'? In the 1990s, the online travel agency market enjoyed economies of scale. Economics were characterized by: - high fixed to develop and maintain a hotel transaction processing engine - low variable costs per transaction By mid-2000 the industry's barriers to entry dissipated. The benefits of these early infrastructure investments were greatly diminished due to new, lower cost alternatives for transaction processing. Which company spent very little on R&D and was still able to gain significant market share? By 2010 or thereabouts, the travel market faced a competitive onslaught from new comparison shopping engines that created a dramatic increase in price transparency. Metasearch engines crawl the websites of travel agencies and travel service providers to provide rich comparison shopping experiences. These real-time comparison shopping solutions provide comparisons across price, features, availability and quality. Metasearch players make money by collecting referral fees from agencies and service providers and from advertising revenue. Well known players include Kayak (Booking, 2013-present), TripAdvisor (Expedia 2004-2011), Trivago (Expedia 2013-present) and Travelzoo. Metasearch players impact the online travel agency market by: - Enabling full, transparent price discovery - Commoditizing the service of online travel agencies, making the source of the hotel room or airline ticket indistinguishable and undifferentiated - Undermining the travel website brand value - Challenging the network effect Is the advent of these services favorable or unfavorable for online travel websites? With low Barriers to Entry, if more players enter the market, is the pricing model more likely to be similar to an Oligopoly or a competitive market going forward? who might a new entrant be Google AirBnB Liquidity and Cash Amazon More often than nd All of the above grow revenues, they grow their investment in Non-cash Working Capital vear-over-vear which reduces Free Cash Flow. Profitability Now let's look at the profitability of the industry and its major competitors. 2007 45% 79% 82% 2008 51% 78% 81% 99% 2015 93% 80% Gross Margin BKNG EXPE oww TRIP Average 2016 96% 82% 2017 98% 83% 2012 78% 78% 81% 98% 2018 98% 82% 2009 54% 79% 81% 99% 78% 2010 62% 77% 82% 98% 80% 2011 71% 78% 82% 98% 82% 2013 849 78% 82% 98% 86% 2014 90% 80% 81% 97% 87% 96% 90% 95% 91% 95% 92% 95% 92% 69% 77% 84% 2008 1% R&D Percent BKNG EXPE Oww TRIP 2007 1% 7% 0% 2015 1% 12% 2016 1% 14% 2018 29 2017 1% 14% 14% 10% 0% 2009 1% 11% 09 8% 5% 2010 1% 10% 0% 9% 5% 2011 1% 11% 0% 9% 5% 2012 1% 12% 0% 11% 6% 2013 1% 12% 0% 14% 7% 2014 1% 12% 0% 14% 7% 16% 17% 10% 5% 14% 9% 16% 11% Average 3% 10% 11% 2007 35% 52% 77% 2015 57% 62% SG&A Percent BKNG EXPE Oww TRIP Average 2010 36% 51% 83% 43% 2016 68% 62% 2017 61% 63% 2008 34% 49% 74% 47% 51% 2018 60% 62% 2009 33% 49% 118% 43% 61% 2014 52% 59% 72% 2011 38% 53% 81% 46% 55% 2012 42% 55% 115% 48% 65% 2013 48% 58% 749 53% 58% 56% 60% 67% 62% 68% 66% 72% 65% 66% 63% 55% 53% 2007 13% 27% 12% 2015 38% 14% 2016 30% 14% 2017 39% 15% EBITDA Margin BKNG EXPE Oww TRIP Average 2018 40% 15% 2008 18% 26% 14% 49% 27% 2009 22% 26% -28% 54% 19% 2010 27% 21% 8% 52% 27% 2011 33% 20% 9% 47% 27% 2012 36% 16% -26% 42% 17% 2013 37% 14% 14% 35% 25% 2014 39% 15% 15% 33% 25% 22% 25% 18% 21% 15% 23% 19% 24% 17% Expedia's profits eroded over time as Booking was able to sustain its superior profitability Net Margin BKNG EXPE 2007 11% 11% 2008 10% -86% 2009 21% 11% 2010 17% 14% 2011 24% 14% 2012 27% 7% 2013 28% 5% 2014 29% 7% 2015 28% 11% 2016 20% 3% 2017 18% 4% 2018 28% 4% As the first mover, Expedia also enjoyed superior profitability coming out of the starting gate. How much greater were Expedia's EBITDA Margin in 2007 than Booking? Across all competitors, the online travel industry achieved strong profitability as a young market taking share as offline bookings moved online. As suggested above, this was because online agencies enjoyed significantly lower cost and higher value than their offline counterparts. Did the online travel industry represent 'value based pricing' or 'cost based pricing'? In the 1990s, the online travel agency market enjoyed economies of scale. Economics were characterized by: - high fixed to develop and maintain a hotel transaction processing engine - low variable costs per transaction By mid-2000 the industry's barriers to entry dissipated. The benefits of these early infrastructure investments were greatly diminished due to new, lower cost alternatives for transaction processing. Which company spent very little on R&D and was still able to gain significant market share? By 2010 or thereabouts, the travel market faced a competitive onslaught from new comparison shopping engines that created a dramatic increase in price transparency. Metasearch engines crawl the websites of travel agencies and travel service providers to provide rich comparison shopping experiences. These real-time comparison shopping solutions provide comparisons across price, features, availability and quality. Metasearch players make money by collecting referral fees from agencies and service providers and from advertising revenue. Well known players include Kayak (Booking, 2013-present), TripAdvisor (Expedia 2004-2011), Trivago (Expedia 2013-present) and Travelzoo. Metasearch players impact the online travel agency market by: - Enabling full, transparent price discovery - Commoditizing the service of online travel agencies, making the source of the hotel room or airline ticket indistinguishable and undifferentiated - Undermining the travel website brand value - Challenging the network effect Is the advent of these services favorable or unfavorable for online travel websites? With low Barriers to Entry, if more players enter the market, is the pricing model more likely to be similar to an Oligopoly or a competitive market going forward? who might a new entrant be Google AirBnB Liquidity and Cash Amazon More often than nd All of the above grow revenues, they grow their investment in Non-cash Working Capital vear-over-vear which reduces Free Cash Flow


