

Question
.Profitability ratios a. return on capital employed b. return on assets ratio c. return on equity ratio d. gross profit ratio/gross profit margin e. net
.Profitability ratios a. return on capital employed b. return on assets ratio c. return on equity ratio d. gross profit ratio/gross profit margin e. net profit to sales ratio et profit margin f. expenses to sales ratio 2.Liquidity ratio/ short term solvency ratios a .Current ratio b. liquidity ratio/ quick ratio c. acid test ratio 3.Activity or efficiency ratios a. Stock Turnover ratio b .Stock turnover period c. Debtor collection period d. Creditor payment period e .Sales to total asset ratio f. sales to capital employed ratio 4. Leverage / gearing / long term solvency a. Debt ratio b. Debt to equity ratio c. Capital employed to net worth ratio d. Coverage ratio 5. Investment ratios a. Earnings per share b. Dividend per share c. Dividend cover d .Payout ratio e .Price earnings ratio f. Earning yield g. Dividend yield h.Net book value per share
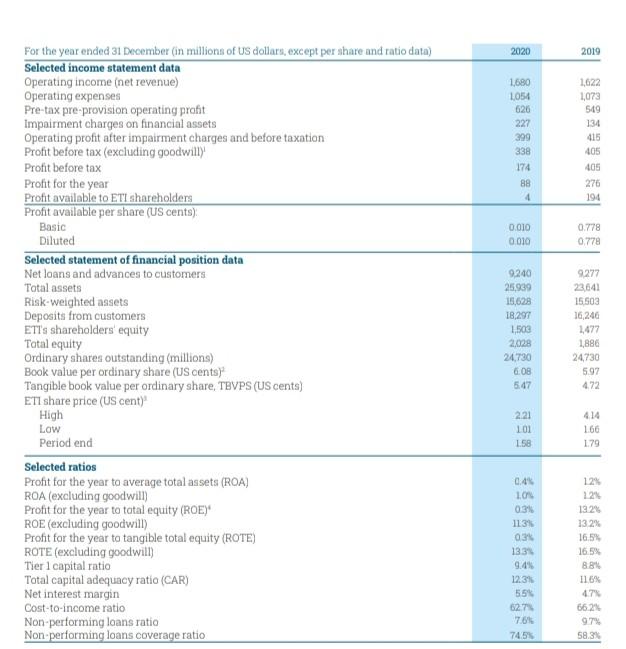
2020 2019 1680 1,054 626 227 399 338 174 88 4 1,622 1,073 549 134 416 405 405 276 194 0.010 0.010 0.778 0.778 For the year ended 31 December (in millions of US dollars, except per share and ratio data) Selected income statement data Operating income (net revenue) Operating expenses Pre-tax pre provision operating profit Impairment charges on financial assets Operating profit after impairment charges and before taxation Profit before tax (excluding goodwilly Profit before tax Profit for the year Profit available to ETI shareholders Profit available per share (US cents) Basic Diluted Selected statement of financial position data Net loans and advances to customers Total assets Risk-weighted assets Deposits from customers ETTs shareholders' equity Total equity Ordinary shares outstanding (millions) Book value per ordinary share (US cents Tangible book value per ordinary share, TBVPS (US cents) ETI share price (US cent) High Low Period end Selected ratios Profit for the year to average total assets (ROA) ROA (excluding goodwill) Profit for the year to total equity (ROE) ROE (excluding goodwill) Profit for the year to tangible total equity (ROTE) ROTE (excluding goodwill) Tier 1 capital ratio Total capital adequacy ratio (CAR) Net interest margin Cost-to-income ratio Non-performing loans ratio Non performing loans coverage ratio 9.240 25,939 15,628 18.297 1,503 2.028 24.730 6.08 5.47 9277 23.641 15.503 16,246 1,477 1,880 24730 5.97 472 2.21 101 1.58 414 160 1.79 0.4% 10 0.3% 113 03 13.31 9.49 12.31 55% 627 7.6% 745 12% 121 13.2% 132 16.5% 16.5% 88 11.6% 47% 66.24 9.7% 58.3%Step by Step Solution
There are 3 Steps involved in it
Step: 1

Get Instant Access to Expert-Tailored Solutions
See step-by-step solutions with expert insights and AI powered tools for academic success
Step: 2

Step: 3
Ace Your Homework with AI
Get the answers you need in no time with our AI-driven, step-by-step assistance
Get Started
Research In Finance
Authors: John W. Kensinger
1st Edition
0857245414, 978-0857245410