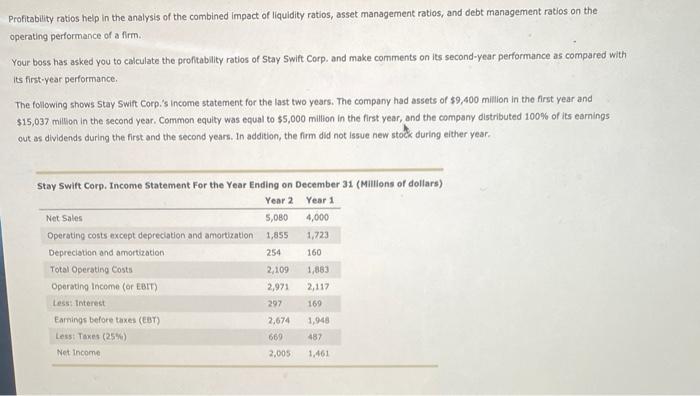
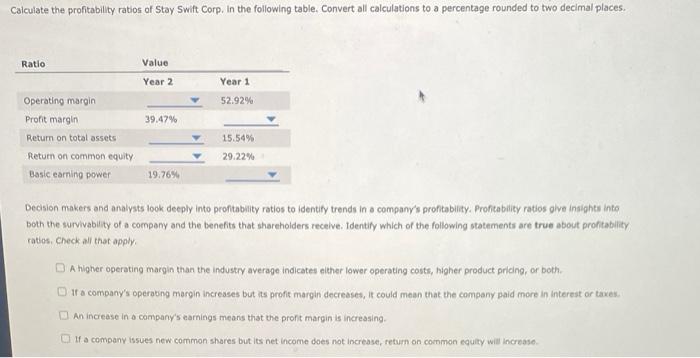
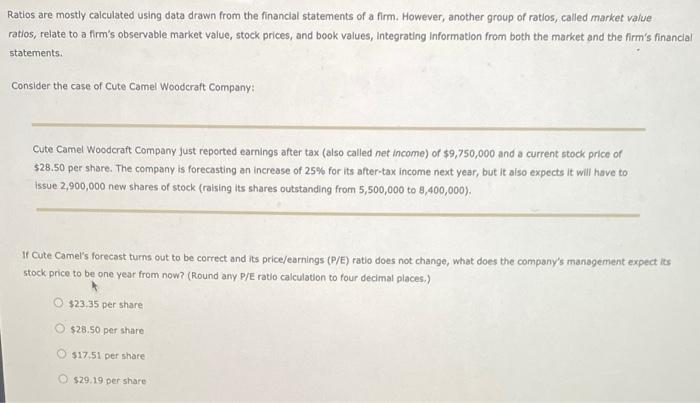
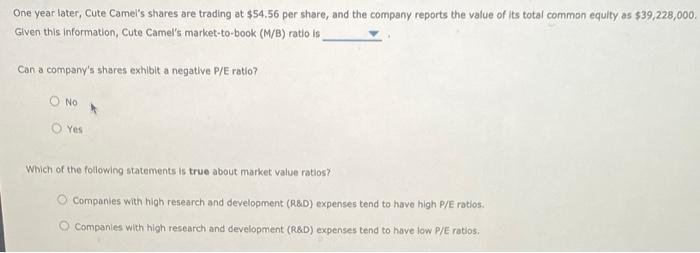
Profitability ratios help in the analysis of the combined impact of liquidity ratios, asset management ratios, and debt management ratios on the operating performance of a firm. Your boss has asked you to calculate the profitability ratios of Stay Swift Corp. and make comments on its second-year performance as compared with its first-year performance The following shows Stay Swift Corp.'s Income statement for the last two years. The company had assets of $9,400 million in the first year and $15,037 million in the second year. Common equity was equal to $5,000 million in the first year, and the company distributed 100% of its earnings out as dividends during the first and the second years. In addition, the firm did not Issue new stock during either year. Stay Swift Corp, Income Statement For the Year Ending on December 31 (Millions of dollars) Year 2 Year 1 Net Sales 5,080 4,000 Operating costs except depreciation and amortization 1,855 1,723 Depreciation and amortization 254 160 Total Operating costs 2,109 Operating Income (or EBIT) 2,971 2,117 Less: Interest 297 169 Earnings before taxes (CBT) 2,674 1,948 Less: Taxes (25%) 669 487 Net Income 2,005 1.461 1,883 Calculate the profitability ratios of Stay Swift Corp. In the following table. Convert all calculations to a percentage rounded to two decimal places. Ratio Value Year 2 Year 1 52.92% 39.47% Operating margin Profit margin Return on total assets Return on common equity Basic earning power 15.54% 29.22% 19.76% Decision makers and analysts look deeply into profitability ratlos to identity trends in a company's profitability. Profitability ratios give insights into both the survivability of a company and the benefits that shareholders receive. Identity which of the following statements are true about profitability ratios. Check all that apply. A higher operating margin that the Industry average Indicates either lower operating costs, higher product pricing, or both Of a company's operating margin increases but its profit margin decreases, it could mean that the company paid more in interest or taxes. An increase in a company's earnings means that the profit margin is increasing If a company issues new common shares but its net income does not increase, return on common equity will increase Ratios are mostly calculated using data drawn from the financial statements of a firm. However, another group of ratios, called market value ratios, relate to a firm's observable market value, stock prices, and book values, Integrating Information from both the market and the firm's financial statements. Consider the case of Cute Camel Woodcraft Company: Cute Camel Woodcraft Company Just reported earnings after tax (also called net income) of $9,750,000 and a current stock price of $28.50 per share. The company is forecasting an increase of 25% for its after-tax income next year, but it also expects it will have to Issue 2,900,000 new shares of stock (raising its shares outstanding from 5,500,000 to 8,400,000). 11 Cute Camel's forecast turns out to be correct and its price/earnings (P/E) ratio does not change, what does the company's management expect its stock price to be one year from now? (Round any P/E ratio calculation to four decimal places) O $23.35 per share $28.50 per share $17.51 per share $29.19 per share One year later, Cute Camel's shares are trading at $54.56 per share, and the company reports the value of its total common equity as $39,228,000, Given this information, Cute Camel's market-to-book (M/B) ratio is Can a company's shares exhibit a negative P/E ratio? O No Yes Which of the following statements is true about market value ratios? Companies with high research and development (R&D) expenses tend to have high P/E ratios. Companies with high research and development (R&D) expenses tend to have low P/E ratios
