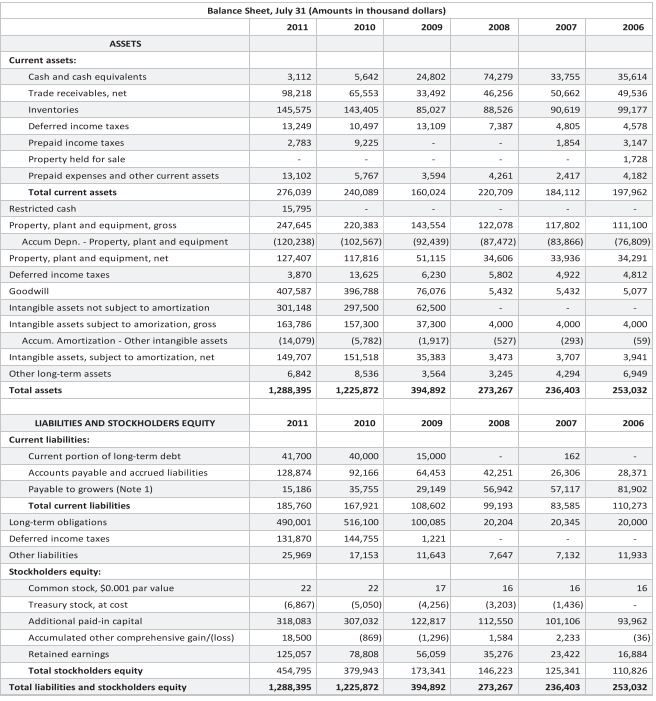
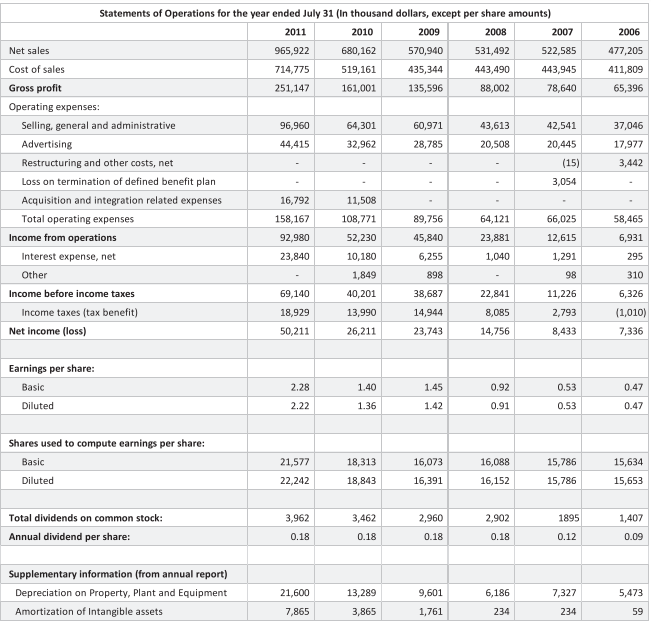
Profitability, Risk, and Cash Flow Analysis:
(a) Prepare common-size statements of operations for the past five fiscal years (20072011) and common-size balance sheets on the respective end of fiscal years for Diamond. Based on your review of the common-size financial statements, describe important changes over the years (20072011) in the financials of Diamond.
(b) Apply the DuPont model (which disaggregates the performance of managers into three componentsprofitability, asset utilization, and financial leverage) to analyze financial performance of Diamond during 20092011


Balance Sheet, July 31 (Amounts in thousand dollars) 2011 2010 2009 2008 2007 2006 ASSETS Current assets: 3,112 98,218 Cash and cash equivalents Trade receivables, net Inventories Deferred income taxes Prepaid income taxes Property held for sale Prepaid expenses and other current assets 5,642 65,553 143,405 10,497 9,225 24,802 33,492 85,027 13,109 74,279 46,256 88,526 7,387 145,575 13,249 2,783 33,755 50,662 90,619 4,805 1,854 35,614 49,536 99,177 4,578 3,147 1,728 13,102 276,039 15,795 5,767 240,089 3,594 160,024 4,261 220,709 2,417 184,112 4,182 197,962 Total current assets Restricted cash 247,645 220,383 117,802 111.100 (102,567) 117,816 13,625 122,078 (87,472) 34,606 5,802 5,432 (76,809) 34,291 (83,866) 33,936 4,922 5,432 4.812 396,788 5,077 Property, plant and equipment, gross Accum Depn. - Property, plant and equipment Property, plant and equipment, net Deferred income taxes Goodwill Intangible assets not subject to amortization Intangible assets subject to amorization, gross Accum. Amortization - Other intangible assets Intangible assets, subject to amortization, net Other long-term assets Total assets (120,238) 127,407 3,870 407,587 301,148 163,786 (14,079) 149,707 6,842 1,288,395 297,500 157,300 (5.782) 151,518 8,536 1,225,872 143,554 (92,439) 51,115 6,230 76,076 62,500 37,300 (1,917) 35,383 3,564 394,892 4,000 (527) 3,473 3,245 273,267 4,000 (293) 3,707 4,294 236,403 4,000 (59) 3,941 6,949 253,032 2011 2010 2009 2008 2007 2006 41,700 128.874 28,371 15,186 185,760 490,001 131,870 25,969 40,000 92,166 35,755 167,921 516,100 144,755 17,153 LIABILITIES AND STOCKHOLDERS EQUITY Current liabilities: Current portion of long-term debt Accounts payable and accrued liabilities Payable to growers (Note 1) Total current liabilities Long-term obligations Deferred income taxes Other liabilities Stockholders equity: Common stock, $0.001 par value Treasury stock, at cost Additional paid-in capital Accumulated other comprehensive gain/(loss) Retained earnings Total stockholders equity Total liabilities and stockholders equity 15,000 64,453 29,149 108,602 100,085 1,221 11,643 42,251 56,942 99,193 20,204 162 26,306 57,117 83,585 20,345 81,902 110,273 20,000 7,647 7,132 11,933 16 22 (6,867) 318,083 18,500 125,057 454,795 1,288,395 22 (5,050) 307,032 (869) 78,808 379,943 1,225,872 17 (4,256) 122,817 (1,296) 56,059 173,341 394,892 16 (3,203) 112,550 1,584 35,276 146,223 273,267 16 (1,436) 101,106 2,233 23,422 125,341 236,403 93,962 (36) 16,884 110,826 253,032 2006 477,205 411,809 65,396 37,046 17,977 3,442 Statements of Operations for the year ended July 31 (In thousand dollars, except per share amounts) 2011 2010 2009 2008 2007 Net sales 965,922 680,162 570,940 531,492 522,585 Cost of sales 714,775 519,161 435,344 443,490 443,945 Gross profit 251,147 161,001 135,596 88,002 78,640 Operating expenses: Selling, general and administrative 96,960 64,301 60,971 43,613 42,541 Advertising 44,415 32,962 28,785 20,508 20,445 Restructuring and other costs, net (15) Loss on termination of defined benefit plan 3,054 Acquisition and integration related expenses 16,792 11,508 Total operating expenses 158,167 108,771 89,756 64,121 66,025 Income from operations 92,980 52,230 45,840 23,881 12,615 Interest expense, net 23,840 10,180 6,255 1,040 1,291 Other 1,849 898 98 Income before income taxes 69,140 40,201 38,687 22,841 11,226 Income taxes (tax benefit) 18,929 13,990 14,944 8,085 2,793 Net Income (loss) 50,211 26,211 23,743 14,756 8,433 58,465 6,931 295 310 6,326 (1,010) 7,336 Earnings per share: Basic 0.47 2.28 2.22 1.40 1.36 1.45 1.42 0.92 0.91 0.53 0.53 Diluted 0.47 Shares used to compute earnings per share: 16,073 Basic Diluted 21,577 22,242 18,313 18,843 16,088 16,152 15,786 15,786 15,634 15,653 16,391 3,462 Total dividends on common stock: Annual dividend per share: 3,962 0.18 2,960 0.18 2,902 0.18 1895 0.12 1,407 0.09 0.18 Supplementary information (from annual report) Depreciation on Property, Plant and Equipment Amortization of Intangible assets 21,600 7,865 13,289 3,865 9,601 1,761 6,186 234 7,327 234 5,473 59 Balance Sheet, July 31 (Amounts in thousand dollars) 2011 2010 2009 2008 2007 2006 ASSETS Current assets: 3,112 98,218 Cash and cash equivalents Trade receivables, net Inventories Deferred income taxes Prepaid income taxes Property held for sale Prepaid expenses and other current assets 5,642 65,553 143,405 10,497 9,225 24,802 33,492 85,027 13,109 74,279 46,256 88,526 7,387 145,575 13,249 2,783 33,755 50,662 90,619 4,805 1,854 35,614 49,536 99,177 4,578 3,147 1,728 13,102 276,039 15,795 5,767 240,089 3,594 160,024 4,261 220,709 2,417 184,112 4,182 197,962 Total current assets Restricted cash 247,645 220,383 117,802 111.100 (102,567) 117,816 13,625 122,078 (87,472) 34,606 5,802 5,432 (76,809) 34,291 (83,866) 33,936 4,922 5,432 4.812 396,788 5,077 Property, plant and equipment, gross Accum Depn. - Property, plant and equipment Property, plant and equipment, net Deferred income taxes Goodwill Intangible assets not subject to amortization Intangible assets subject to amorization, gross Accum. Amortization - Other intangible assets Intangible assets, subject to amortization, net Other long-term assets Total assets (120,238) 127,407 3,870 407,587 301,148 163,786 (14,079) 149,707 6,842 1,288,395 297,500 157,300 (5.782) 151,518 8,536 1,225,872 143,554 (92,439) 51,115 6,230 76,076 62,500 37,300 (1,917) 35,383 3,564 394,892 4,000 (527) 3,473 3,245 273,267 4,000 (293) 3,707 4,294 236,403 4,000 (59) 3,941 6,949 253,032 2011 2010 2009 2008 2007 2006 41,700 128.874 28,371 15,186 185,760 490,001 131,870 25,969 40,000 92,166 35,755 167,921 516,100 144,755 17,153 LIABILITIES AND STOCKHOLDERS EQUITY Current liabilities: Current portion of long-term debt Accounts payable and accrued liabilities Payable to growers (Note 1) Total current liabilities Long-term obligations Deferred income taxes Other liabilities Stockholders equity: Common stock, $0.001 par value Treasury stock, at cost Additional paid-in capital Accumulated other comprehensive gain/(loss) Retained earnings Total stockholders equity Total liabilities and stockholders equity 15,000 64,453 29,149 108,602 100,085 1,221 11,643 42,251 56,942 99,193 20,204 162 26,306 57,117 83,585 20,345 81,902 110,273 20,000 7,647 7,132 11,933 16 22 (6,867) 318,083 18,500 125,057 454,795 1,288,395 22 (5,050) 307,032 (869) 78,808 379,943 1,225,872 17 (4,256) 122,817 (1,296) 56,059 173,341 394,892 16 (3,203) 112,550 1,584 35,276 146,223 273,267 16 (1,436) 101,106 2,233 23,422 125,341 236,403 93,962 (36) 16,884 110,826 253,032 2006 477,205 411,809 65,396 37,046 17,977 3,442 Statements of Operations for the year ended July 31 (In thousand dollars, except per share amounts) 2011 2010 2009 2008 2007 Net sales 965,922 680,162 570,940 531,492 522,585 Cost of sales 714,775 519,161 435,344 443,490 443,945 Gross profit 251,147 161,001 135,596 88,002 78,640 Operating expenses: Selling, general and administrative 96,960 64,301 60,971 43,613 42,541 Advertising 44,415 32,962 28,785 20,508 20,445 Restructuring and other costs, net (15) Loss on termination of defined benefit plan 3,054 Acquisition and integration related expenses 16,792 11,508 Total operating expenses 158,167 108,771 89,756 64,121 66,025 Income from operations 92,980 52,230 45,840 23,881 12,615 Interest expense, net 23,840 10,180 6,255 1,040 1,291 Other 1,849 898 98 Income before income taxes 69,140 40,201 38,687 22,841 11,226 Income taxes (tax benefit) 18,929 13,990 14,944 8,085 2,793 Net Income (loss) 50,211 26,211 23,743 14,756 8,433 58,465 6,931 295 310 6,326 (1,010) 7,336 Earnings per share: Basic 0.47 2.28 2.22 1.40 1.36 1.45 1.42 0.92 0.91 0.53 0.53 Diluted 0.47 Shares used to compute earnings per share: 16,073 Basic Diluted 21,577 22,242 18,313 18,843 16,088 16,152 15,786 15,786 15,634 15,653 16,391 3,462 Total dividends on common stock: Annual dividend per share: 3,962 0.18 2,960 0.18 2,902 0.18 1895 0.12 1,407 0.09 0.18 Supplementary information (from annual report) Depreciation on Property, Plant and Equipment Amortization of Intangible assets 21,600 7,865 13,289 3,865 9,601 1,761 6,186 234 7,327 234 5,473 59


