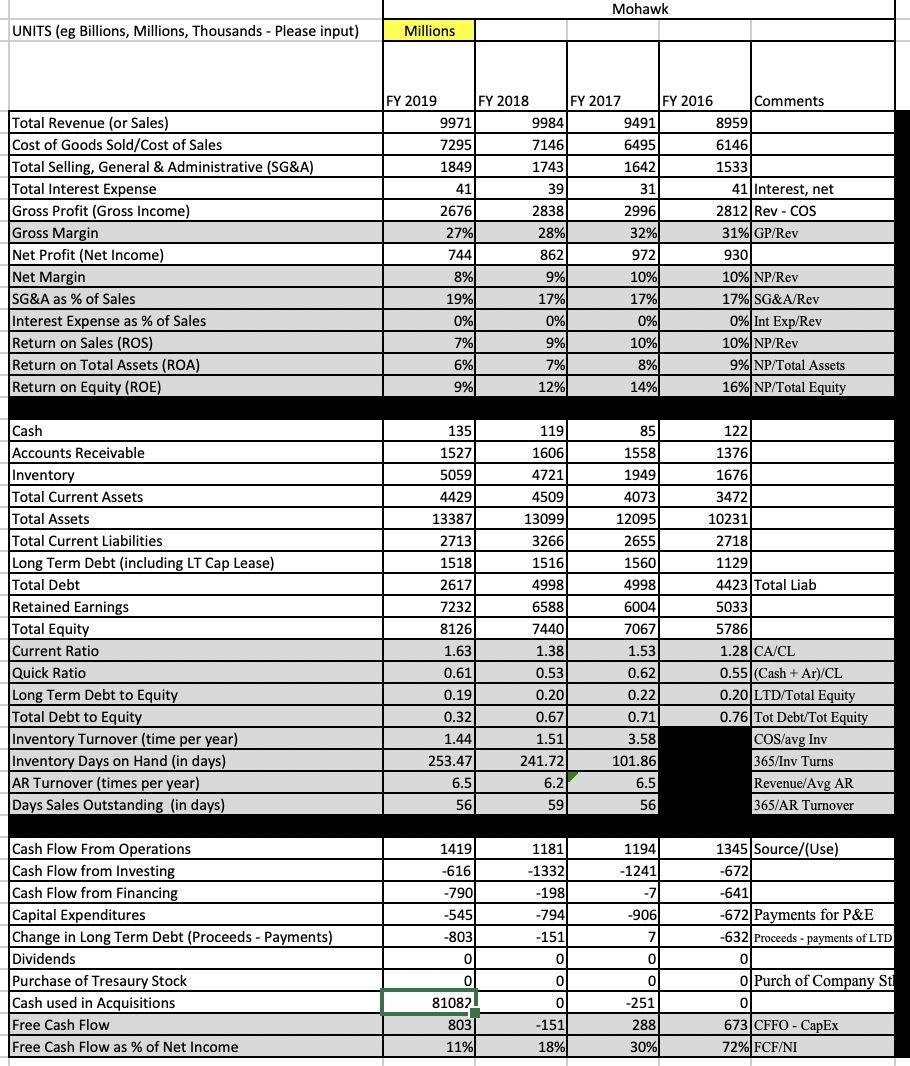
- Profitability/Net Income Margins
- What are the after-tax net income margins (i.e., net profit margins) for both companies?
- How do they compare?
- Who achieves the higher net income margin? Why?
Tip: Analyze the major cost structure line items in the income statement (COGS, SG&A, interest, other, and taxes) as percentages of net sales, so you can identify reasons for better net income margins. Identify and comment on the differences. You may not know why a particular cost item like COGS is higher or lower, and thats okay. Your CEO only wants to know which cost-structure items are higher or lower for each company.

Mohawk UNITS (eg Billions, Millions, Thousands - Please input) Millions 28% Total Revenue (or Sales) Cost of Goods Sold/Cost of Sales Total Selling, General & Administrative (SG&A) Total Interest Expense Gross Profit (Gross Income) Gross Margin Net Profit (Net Income) Net Margin SG&A as % of Sales Interest Expense as % of Sales Return on Sales (ROS) Return on Total Assets (ROA) Return on Equity (ROE) FY 2019 FY 2018 FY 2017 FY 2016 Comments 9971 9984 9491 8959 7295 7146 6495 6146 1849 1743 1642 1533 41 39 31 41 Interest, net 2676 2838 2996 2812 Rev - COS 27% 32% 31% GP/Rev 744 862 972 930 9% 10% 10% NP/Rev 19% 17% 17% 17% SG&A/Rev 0% 0% 0% 0% Int Exp/Rev 7% 9%) 10% 10% NP/Rev 6% 7% 8% 9% NP/Total Assets 9% 12% 14% 16% NP/Total Equity 1191 85 1558 1949 Cash Accounts Receivable Inventory Total Current Assets Total Assets Total Current Liabilities Long Term Debt (including LT Cap Lease) Total Debt Retained Earnings Total Equity Current Ratio Quick Ratio Long Term Debt to Equity Total Debt to Equity Inventory Turnover (time per year) Inventory Days on Hand (in days) AR Turnover (times per year) Days Sales Outstanding (in days) 135 1527 5059 4429 13387 2713 1518 2617 7232 8126 1.63 0.61 0.19 16061 4721 4509 13099 3266 1516 4998 6588 7440 1.38 4073 12095 2655 1560 4998 6004 7067 1.53 0.62 0.22 0.71 3.58 101.86 6.5 56 122 13761 1676 3472 10231 2718 1129 4423 Total Liab 5033 5786 1.28|CA/CL 0.55|(Cash + Ar)/CL 0.20 LTD/Total Equity 0.76 Tot Debt/Tot Equity COS/avg Iny 365/Inv Turns Revenue/Avg AR 365/AR Turnover 0.32 1.44 253.47 0.53 0.20 0.67 1.51 241.72 6.5 6.2 59 56 1194 -1241 1181 -1332 -1981 -794) -7 1419 -616 -790 -545 -803 0 Cash Flow From Operations Cash Flow from Investing Cash Flow from Financing Capital Expenditures Change in Long Term Debt (Proceeds - Payments) Dividends Purchase of Tresaury Stock Cash used in Acquisitions Free Cash Flow Free Cash Flow as % of Net Income -151 -9061 7 0 1345 Source/(Use) -6721 -641 -672 Payments for P&E -632 Proceeds - payments of LTD 0 O Purch of Company St 0 673|CFFO - CapEx 72% FCF/NI 0 0 0 0 0 81082 803 11% -151 -251 288 30% 18% Mohawk UNITS (eg Billions, Millions, Thousands - Please input) Millions 28% Total Revenue (or Sales) Cost of Goods Sold/Cost of Sales Total Selling, General & Administrative (SG&A) Total Interest Expense Gross Profit (Gross Income) Gross Margin Net Profit (Net Income) Net Margin SG&A as % of Sales Interest Expense as % of Sales Return on Sales (ROS) Return on Total Assets (ROA) Return on Equity (ROE) FY 2019 FY 2018 FY 2017 FY 2016 Comments 9971 9984 9491 8959 7295 7146 6495 6146 1849 1743 1642 1533 41 39 31 41 Interest, net 2676 2838 2996 2812 Rev - COS 27% 32% 31% GP/Rev 744 862 972 930 9% 10% 10% NP/Rev 19% 17% 17% 17% SG&A/Rev 0% 0% 0% 0% Int Exp/Rev 7% 9%) 10% 10% NP/Rev 6% 7% 8% 9% NP/Total Assets 9% 12% 14% 16% NP/Total Equity 1191 85 1558 1949 Cash Accounts Receivable Inventory Total Current Assets Total Assets Total Current Liabilities Long Term Debt (including LT Cap Lease) Total Debt Retained Earnings Total Equity Current Ratio Quick Ratio Long Term Debt to Equity Total Debt to Equity Inventory Turnover (time per year) Inventory Days on Hand (in days) AR Turnover (times per year) Days Sales Outstanding (in days) 135 1527 5059 4429 13387 2713 1518 2617 7232 8126 1.63 0.61 0.19 16061 4721 4509 13099 3266 1516 4998 6588 7440 1.38 4073 12095 2655 1560 4998 6004 7067 1.53 0.62 0.22 0.71 3.58 101.86 6.5 56 122 13761 1676 3472 10231 2718 1129 4423 Total Liab 5033 5786 1.28|CA/CL 0.55|(Cash + Ar)/CL 0.20 LTD/Total Equity 0.76 Tot Debt/Tot Equity COS/avg Iny 365/Inv Turns Revenue/Avg AR 365/AR Turnover 0.32 1.44 253.47 0.53 0.20 0.67 1.51 241.72 6.5 6.2 59 56 1194 -1241 1181 -1332 -1981 -794) -7 1419 -616 -790 -545 -803 0 Cash Flow From Operations Cash Flow from Investing Cash Flow from Financing Capital Expenditures Change in Long Term Debt (Proceeds - Payments) Dividends Purchase of Tresaury Stock Cash used in Acquisitions Free Cash Flow Free Cash Flow as % of Net Income -151 -9061 7 0 1345 Source/(Use) -6721 -641 -672 Payments for P&E -632 Proceeds - payments of LTD 0 O Purch of Company St 0 673|CFFO - CapEx 72% FCF/NI 0 0 0 0 0 81082 803 11% -151 -251 288 30% 18%


