Question
%Program 3.1 Newton Divided Difference Interpolation Method %Computes coefficients of interpolating polynomial %Input: x and y are vectors containing the x and y coordinates %

%Program 3.1 Newton Divided Difference Interpolation Method
%Computes coefficients of interpolating polynomial
%Input: x and y are vectors containing the x and y coordinates
% of the n data points
%Output: coefficients c of interpolating polynomial in nested form
%Use with nest.m to evaluate interpolating polynomial
function c=newtdd(x,y,n)
for j=1:n
v(j,1)=y(j); % Fill in y column of Newton triangle
end
for i=2:n % For column i,
for j=1:n+1-i % fill in column from top to bottom
v(j,i)=(v(j+1,i-1)-v(j,i-1))/(x(j+i-1)-x(j));
end
end
for i=1:n
c(i)=v(1,i); % Read along top of triangle
end % for output coefficients
%Program 0.1 Nested multiplication
%Evaluates polynomial from nested form using Horner's method
%Input: degree d of polynomial,
% array of d+1 coefficients (constant term first),
% x-coordinate x at which to evaluate, and
% array of d base points b, if needed
%Output: value y of polynomial at x
function y=nest(d,c,x,b)
if nargin
b=zeros(d,1);
end
y=c(d+1);
for i=d:-1:1
y = y.*(x-b(i))+c(i);
end
end
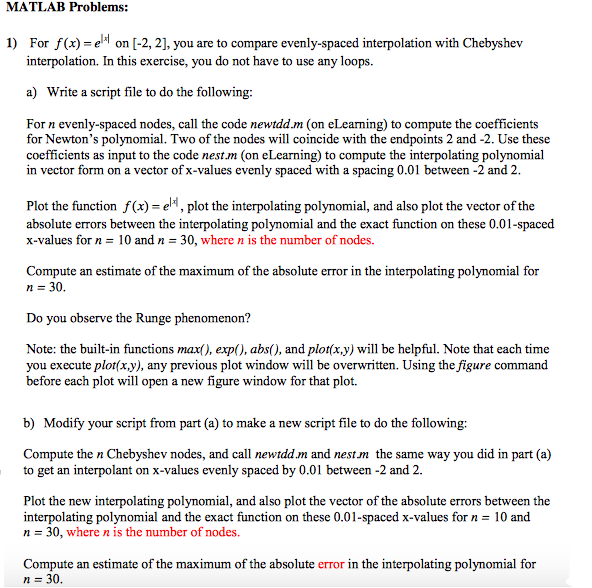
MATLAB Problems: 1) For f(x) e on -2, 2], you are to compare evenly-spaced interpolation with Chebyshev interpolation. In this exercise, you do not have to use any loops. a) Write a script file to do the following: For n evenly-spaced nodes, call the code newtdd.m (on eLearning) to compute the coefficients for Newton's polynomial. Two of the nodes will coincide with the endpoints 2 and -2. Use these coefficients as input to the code nest m (on eLearning) to compute the interpolating polynomial in vector form on a vector of x-values evenly spaced with a spacing 0.01 between -2 and 2. Plot the function f(x) e, plot the interpolating polynomial, and also plot the vector of the absolute errors between the interpolating polynomial and the exact function on these 0.01-spaced x-values for n = 10 and n = 30, where n is the number of nodes. Compute an estimate of the maximum of the absolute error in the interpolating polynomial for n=30 Do you observe the Runge phenomenon? Note: the built-in functions max), exp(), abs(0), and plot(x,y) will be helpful. Note that each time you execute plot(x.y), any previous plot window will be overwritten. Using the figure command before each plot will open a new figure window for that plot. b) Modify your script from part (a) to make a new script file to do the following: Compute the n Chebyshev nodes, and call newtddm and nestm the same way you did in part (a) to get an interpolant on x-values evenly spaced by 0.01 between -2 and 2. Plot the new interpolating polynomial, and also plot the vector of the absolute errors between the interpolating polynomial and the exact function on these 0.01-spaced x-values for n = 10 and n = 30, where n is the number of nodes. Compute an estimate of the maximum of the absolute error in the interpolating polynomial for n=30 MATLAB Problems: 1) For f(x) e on -2, 2], you are to compare evenly-spaced interpolation with Chebyshev interpolation. In this exercise, you do not have to use any loops. a) Write a script file to do the following: For n evenly-spaced nodes, call the code newtdd.m (on eLearning) to compute the coefficients for Newton's polynomial. Two of the nodes will coincide with the endpoints 2 and -2. Use these coefficients as input to the code nest m (on eLearning) to compute the interpolating polynomial in vector form on a vector of x-values evenly spaced with a spacing 0.01 between -2 and 2. Plot the function f(x) e, plot the interpolating polynomial, and also plot the vector of the absolute errors between the interpolating polynomial and the exact function on these 0.01-spaced x-values for n = 10 and n = 30, where n is the number of nodes. Compute an estimate of the maximum of the absolute error in the interpolating polynomial for n=30 Do you observe the Runge phenomenon? Note: the built-in functions max), exp(), abs(0), and plot(x,y) will be helpful. Note that each time you execute plot(x.y), any previous plot window will be overwritten. Using the figure command before each plot will open a new figure window for that plot. b) Modify your script from part (a) to make a new script file to do the following: Compute the n Chebyshev nodes, and call newtddm and nestm the same way you did in part (a) to get an interpolant on x-values evenly spaced by 0.01 between -2 and 2. Plot the new interpolating polynomial, and also plot the vector of the absolute errors between the interpolating polynomial and the exact function on these 0.01-spaced x-values for n = 10 and n = 30, where n is the number of nodes. Compute an estimate of the maximum of the absolute error in the interpolating polynomial for n=30Step by Step Solution
There are 3 Steps involved in it
Step: 1

Get Instant Access to Expert-Tailored Solutions
See step-by-step solutions with expert insights and AI powered tools for academic success
Step: 2

Step: 3

Ace Your Homework with AI
Get the answers you need in no time with our AI-driven, step-by-step assistance
Get Started


