

Question: ******************************************************************************** PROGRAM DESCRIPTION This program reads in a set of Cartesian coordinates as arrays. Then the Cartesian coordinates will be converted to polar coordinates. The
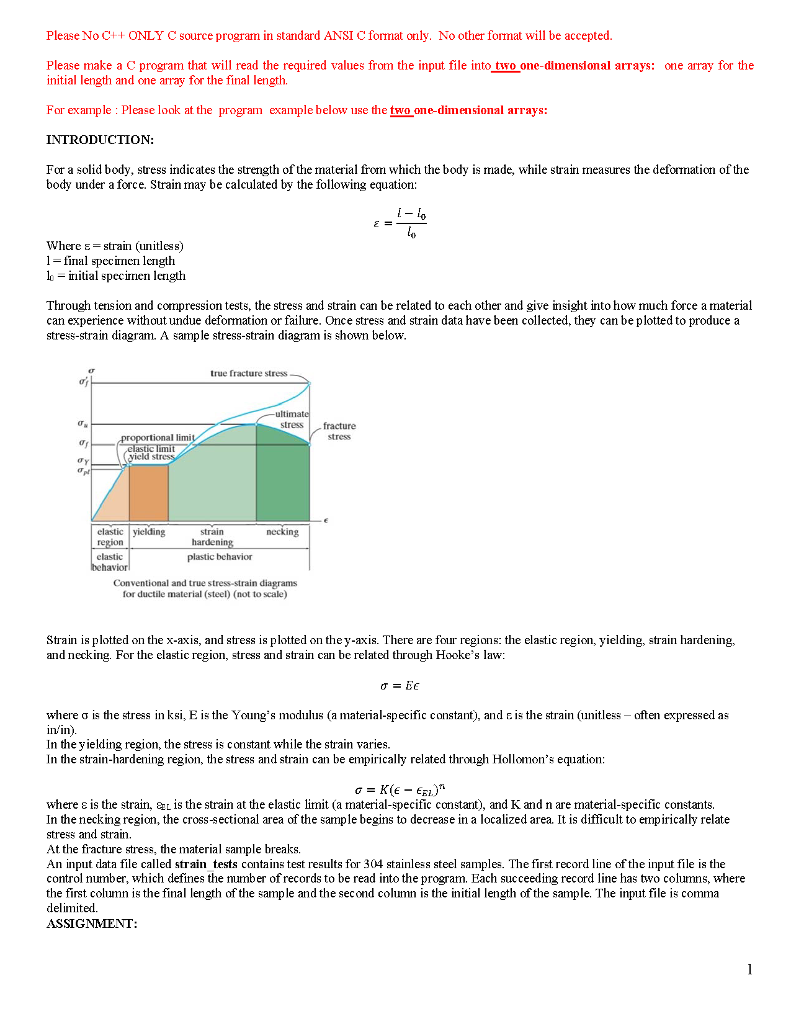
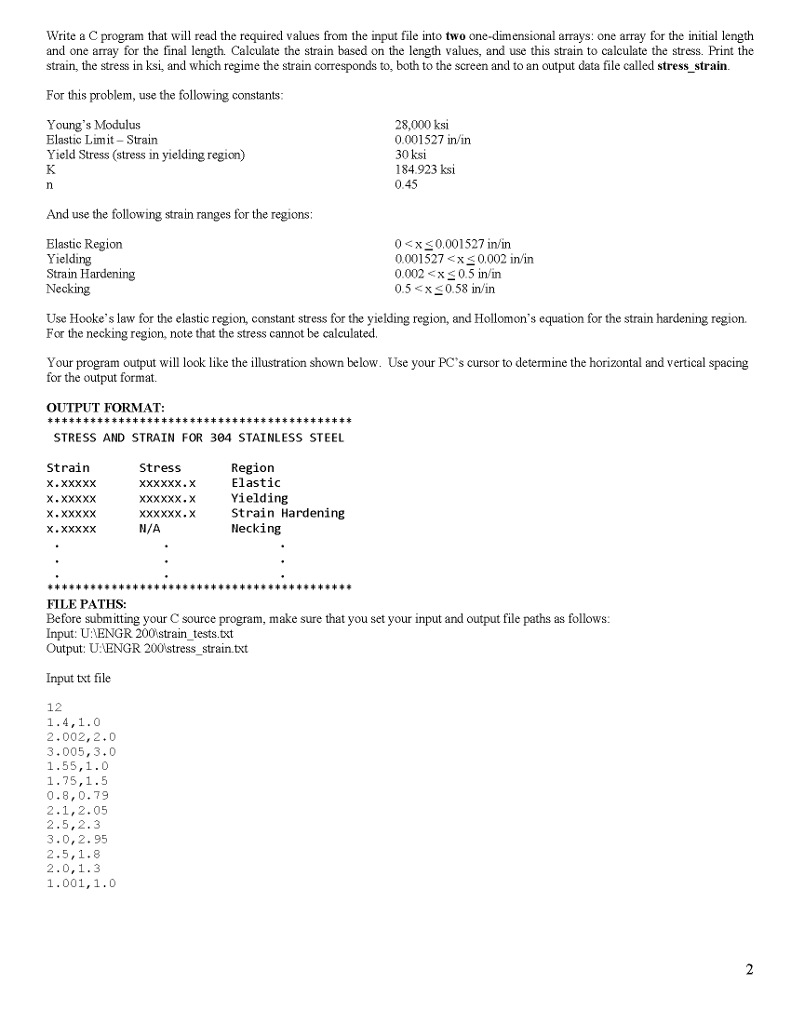
******************************************************************************** PROGRAM DESCRIPTION This program reads in a set of Cartesian coordinates as arrays. Then the Cartesian coordinates will be converted to polar coordinates. The converted coordinates will also be stored in arrays, and the Cartesian coordinates and polar coordinates will print to the screen. DESCRIPTION OF VARIABLES NAME | TYPE | DESCRIPTION ----------------------------------------------------------------------------- xdata | double | array containing x coordinate data ydata | double | array containing y coordinate data radius | double | array containing radii for polar coordinates angle | double | array containing angles in deg. for polar coords. radians | double | angle for polar coordinates in radians i | int | loop indexing variable ndata | int | number of data points in input file *******************************************************************************/ /* Preprocessor directives */ #include#include #define PI 3.14159 #define input_file "U:\\ENGR 200\\xy_coordinates.txt" /* Main function */ int main(void) { /* Declare variables */ double xdata[10], ydata[10], radius[10], angle[10], radians; int i, ndata; FILE *xy = NULL; /* Print headings */ printf("********************************************"); printf(" CARTESIAN TO POLAR COORDINATES "); /* Open input file */ xy = fopen(input_file, "r"); /* Verify input file */ if(xy==NULL) { printf(" Error opening input file. "); printf(" Program terminated "); return 1; } /* Read control number from input file */ fscanf(xy,"%i",&ndata); /* Read x and y data from input file */ for(i=0; i Please No C+ ONLY C source program in standard ANSI C format only. No other format will be accepted. Please make a Cprogram that will read the required values from the input file into two one-dimensional arrays: one array for the initial length and one array for the final length. For example Please look at the program example below use the two one-dimensional arrays: INTRODUCTION: For a solid body, stress indicates the strength of the material from which the body is made, while strain measures the deformation of the body under a force. Strain may be calculated by the following equation: where = strain (unitless 1-final specimen length o iitial specimen lerigth Through tension and compression tests, the stress and strain can be related to each other and give insight into how much force a material can experience without undue deformation or failure. Once stress and strain data have been collected, they can be plotted to produce a stress-strain diagram. A sample stress-strain diagram is shown below rue fracture stress stress fracture stress al limi yield st elastic yiclding strain harden necking clastic plastic bchavior Conventional and true stress-strain diagrams for ductile material (steel) (not to scale) Strain is plotted on the x-axis, and stress is plotted on they-axis. There are four regions: the elastic region, yielding, strain hardening, and necking. For the elastic region, stress and strain can be related through Hooke's law: where is the gress in ks, E is the Young's modulus (a material specific constant), and Eis the strain (unitless nn in In the yielding region, the stress is constant while the strain varies. In the strain-hardening region, the stress and strain can be empirically related through Hollomon's equationn often expressed as where e is the strain, &at is the strain at the elastic limit (a material-specific constant), and K and n are material-specific constants. In the necking region, the cross-sectional area of the sample begins to decrease in a localized area. It is difficult to empirically relate stress and strain. At the fracture stress, the material sample breaks. An input data file called strain tests contains test results for 304 stainless steel samples. The first. record line of the input file is the control number, which defines the number of records to be read into the program. Each succeeding record line has two columns, where the first. column is the final length of the sample and the second column is the initial length of the sample. The input. file is comma delimited, ASSIGNMENT Please No C+ ONLY C source program in standard ANSI C format only. No other format will be accepted. Please make a Cprogram that will read the required values from the input file into two one-dimensional arrays: one array for the initial length and one array for the final length. For example Please look at the program example below use the two one-dimensional arrays: INTRODUCTION: For a solid body, stress indicates the strength of the material from which the body is made, while strain measures the deformation of the body under a force. Strain may be calculated by the following equation: where = strain (unitless 1-final specimen length o iitial specimen lerigth Through tension and compression tests, the stress and strain can be related to each other and give insight into how much force a material can experience without undue deformation or failure. Once stress and strain data have been collected, they can be plotted to produce a stress-strain diagram. A sample stress-strain diagram is shown below rue fracture stress stress fracture stress al limi yield st elastic yiclding strain harden necking clastic plastic bchavior Conventional and true stress-strain diagrams for ductile material (steel) (not to scale) Strain is plotted on the x-axis, and stress is plotted on they-axis. There are four regions: the elastic region, yielding, strain hardening, and necking. For the elastic region, stress and strain can be related through Hooke's law: where is the gress in ks, E is the Young's modulus (a material specific constant), and Eis the strain (unitless nn in In the yielding region, the stress is constant while the strain varies. In the strain-hardening region, the stress and strain can be empirically related through Hollomon's equationn often expressed as where e is the strain, &at is the strain at the elastic limit (a material-specific constant), and K and n are material-specific constants. In the necking region, the cross-sectional area of the sample begins to decrease in a localized area. It is difficult to empirically relate stress and strain. At the fracture stress, the material sample breaks. An input data file called strain tests contains test results for 304 stainless steel samples. The first. record line of the input file is the control number, which defines the number of records to be read into the program. Each succeeding record line has two columns, where the first. column is the final length of the sample and the second column is the initial length of the sample. The input. file is comma delimited, ASSIGNMENT
Step by Step Solution
There are 3 Steps involved in it
1 Expert Approved Answer
Step: 1 Unlock

Question Has Been Solved by an Expert!
Get step-by-step solutions from verified subject matter experts
Step: 2 Unlock
Step: 3 Unlock