

Question
program : Dictionaries and File Processing . Nova Scotias Income Tax Calculator: Employees within the province of Nova Scotia are taxed at different levels -
program : Dictionaries and File Processing
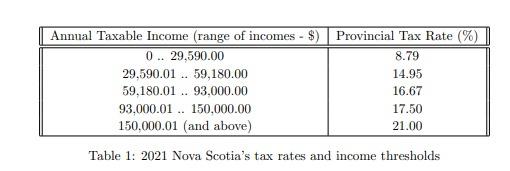
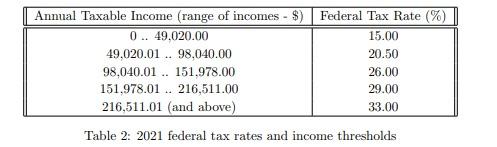
. Nova Scotias Income Tax Calculator: Employees within the province of Nova Scotia are taxed at different levels - Federal and Provincial. Other deductions like Canadian Pension Plan (CPP), Employment Insurance, and Tax amounts are computed according to salary brackets. (See Payroll Deduction for Nova Scotia Province Effective January 1, 2021) Nova Scotias (i.e., provincial) tax rates and thresholds are given in table 1 while that of federal is given in table 2. Other deductions include CPP (Canada Pension Plan) and EI (Employment Insurance). While CPP is 5.25% of the gross income (but to a maximum amount of $2,898.00), EI is 1.58% of the gross income (but to a maximum amount of $856.36)
You are to note that the computations for provincial and federal taxes are have been revised in comparison with the first assignment but remain unchanged from assignment 2. In particular this computations are still valid for gross income of $92,486.79, the taxes are computed below: Provincial Tax: $12,576.91 = $(2,600.96 + 4,423.70 + 5,552.24) 1st category $29,590 is tax at the rate of 8.79% = $2,600.96 2nd category ($59,180.00 - $29,590.01) is taxed at the rate of 14.95% = $4,423.70 Remainder (i.e., $92,486.79 - $59,180.01) is taxed at the rate of 16.67% = $5,552.24 Federal Tax: $16,263.69 = $(7,353.00 + 8,910.69) 1st category $49,020.00 is tax at the rate of 15.0% = $7,353.00 Remainder (i.e., $92,486.79 - $49,020.01) is taxed at the rate of 20.5% = $8,910.69 In addition to the deductions above assuming Nova Scotias employees are charged health premiums and that the premiums are based on the following rules: (a) If the taxable income is less than or equal to $22,000.00, the premium is $0.00. (b) If the taxable income is greater than $22, 000.00 and less than or equal to $38, 000.00, the premium is equal to the lesser of: (i) $300.00 and (ii) 6% of (taxable income - $22,000.00); (c) If the taxable income is greater than $38, 000.00 and less than or equal to $50, 000.00, the premium is equal to the lesser of: (i) $450.00 and (ii) 300 + 6% of (taxable income - $38,000.00); (d) If the taxable income is greater than $50, 000.00 and less than or equal to $74, 000.00, the premium is equal to the lesser of: (i) $600.00 and (ii) 450 + 25% of (taxable income - $50,000.00); (e) If the taxable income is greater than $74, 000.00 and less than or equal to $202, 000.00, the premium is equal to the lesser of: (i) $750.00 and (ii) 600 + 25% of (taxable income - $74,000.00); (f) If the taxable income is greater than $202, 000.00, the premium is equal to the lesser of: (i) $900.00 and (ii) 750 + 25% of (taxable income - $202,000.00). Write a program that: take gross income of N employees from an excel file (*.xls or *.xslx format), convert the file to its JSON equivalent (for interoperability purposes); read gross income of N employees from the generated JSON file and do the following: compute their net incomes (i.e., after deducting appropriate provincial and federal level taxes); compute and display population variance, and median for the entire net incomes; display means (or averages) of all gross and net incomes; and average of all modes (use Dictionary data structure dont copy online codes) for the entire net incomes
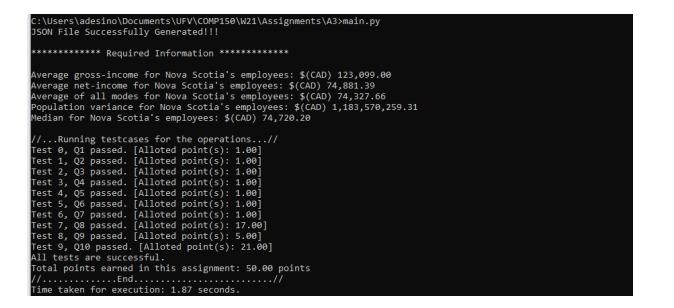
Median Computations differ for even and odd lengths of any given list. Even length: let lst = [1, 2, 8, 5, 6, 3], lst = sort(lst) = median(lst) = (3 + 5)/2 = 4 Odd length: let lst = [1, 2, 8, 5, 6], lst = sort(lst) = median(lst) = 5 Mode By definition, it is the net income with the highest frequency. But since there may be more than one net income with same but highest frequency you are to compute the list of all net incomes with highest number of occurrence. For example, let lst = [5, 4, 3, 2, 1, 3, 2, 1] = modes(lst) = [3, 2, 1] Excel File Two files of data (randomly generated) in excel formats. The files contain exactly the same data you may use any of them in your program. If you decide to try both of them out they should give the same output. Variance This is the square of standard deviation, that is V ar([x0, x1, . . . , xN1]) = 2 . 2 = V ar([x0, x1, . . . , xN1]) = PN1 i=0 (xi k) 2 N , (1) such that: k = ([x0, x1, . . . , xN1]) = PN1 i=0 xi N (2) HINT: Pn i=1 xi with xi [1, 2, 3, 4, 5, 6] = 1 + 2 + 3 + 4 + 5 + 6 = 21. You are to re-use the standard deviation function you developed in assignment 2. Reading Excel and Generating JSON In the attached stubs, you will find a working code to generate JSON and extract a list of of gross incomes from the input excel file. Your task is to engineer these functions in order to produce a list of gross incomes to compute median and mode. An example test run of the program is given in figure 1. Thus, your program should produce the following output (using the same format and set of taxable incomes) if everything is right:
req: program
Annual Taxable Income (range of incomes - $) Provincial Tax Rate (%) 0.. 29,590.00 8.79 29,590.01 .. 59,180.00 14.95 59.180.01 .. 93,000.00 16.67 93.000.01 .. 150,000.00 17.50 150.000.01 (and above) 21.00 Table 1: 2021 Nova Scotia's tax rates and income thresholds Annual Taxable Income (range of incomes - $) Federal Tax Rate (%) 0.. 49.020.00 15.00 49.020.01. 98,040.00 20.50 98,040.01 .. 151.978.00 26.00 151.978.01. 216,511.00 29.00 216,511.01 (and above) 33.00 Table 2: 2021 federal tax rates and income thresholds C:\Users\adesino\Documents\UFV\COMP150\W21\Assignments\A3>main.py JSON File Successfully Generated!!! ************* Required Information ************ Average gross-income for Nova Scotia's employees: S(CAD) 123,099.ee Average net-income for Nova Scotia's employees: $(CAD) 74,881.39 Average of all modes for Nova Scotia's employees: $(CAD) 74,327,66 Population variance for Nova Scotia's employees: $(CAD) 1,183,578, 259.31 Median for Nova Scotia's employees: S(CAD) 74,720.20 11... Running testcases for the operations...// Test @, 01 passed. [Alloted point(s): 1.6e] Test 1, Q2 passed. [Alloted point(s): 1.00] Test 2, 03 passed. [Alloted point(s): 1.ee] Test 3, 04 passed. [Alloted point($): 1.68] Test 4, 05 passed. [Alloted point(s): 1.00] Test 5, Q6 passed. [Alloted point(s): 1.00] Test 6, 07 passed. [Alloted point(s); 1.80) Test 7, Q8 passed. [Alloted point(s): 17.10] Test 8, 09 passed. [Alloted point(s): 5.80] Test 9, Q10 passed. [Alloted point(s): 21.08] All tests are successful. Total points earned in this assignment: se.ee points Vl... ......End.... .// Time taken for execution: 1.87 secondsStep by Step Solution
There are 3 Steps involved in it
Step: 1

Get Instant Access to Expert-Tailored Solutions
See step-by-step solutions with expert insights and AI powered tools for academic success
Step: 2

Step: 3
Ace Your Homework with AI
Get the answers you need in no time with our AI-driven, step-by-step assistance
Get Started
Implementing And Auditing The Internal Control System
Authors: D. Chorafas
1st Edition
0333929365, 9780333929360