Program in C++ please! thank you for your help.


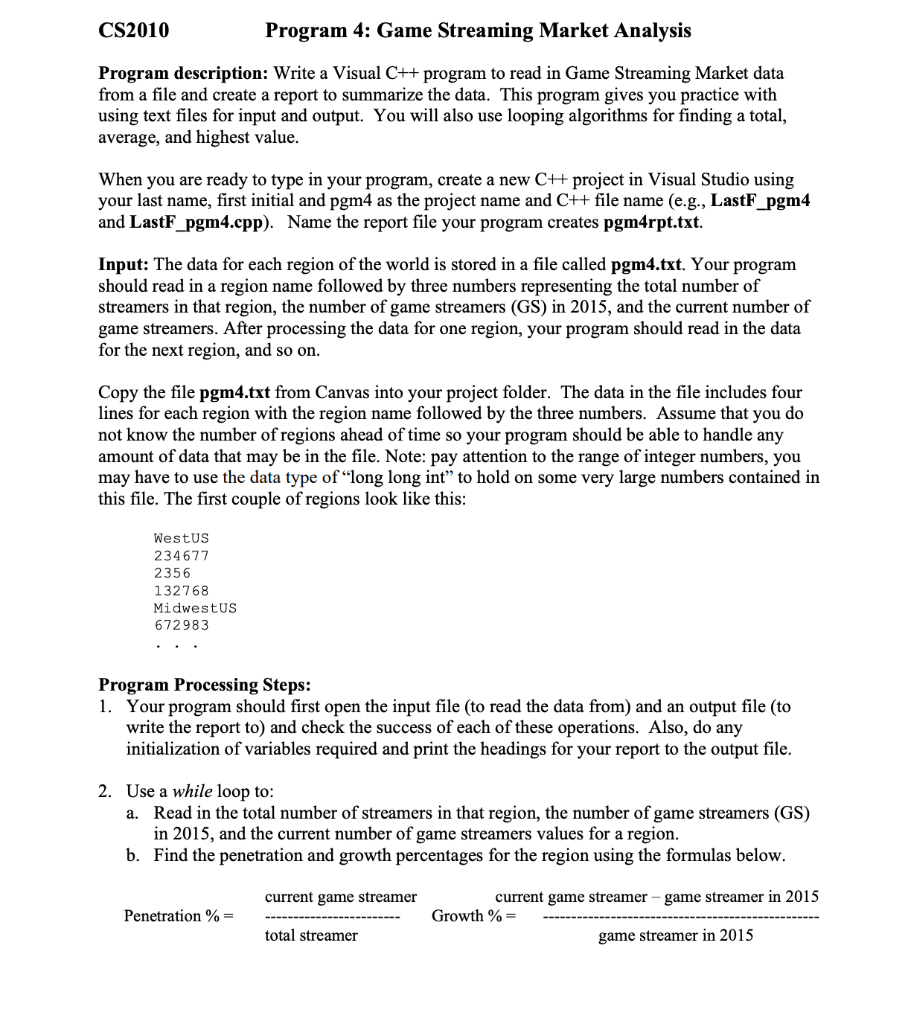
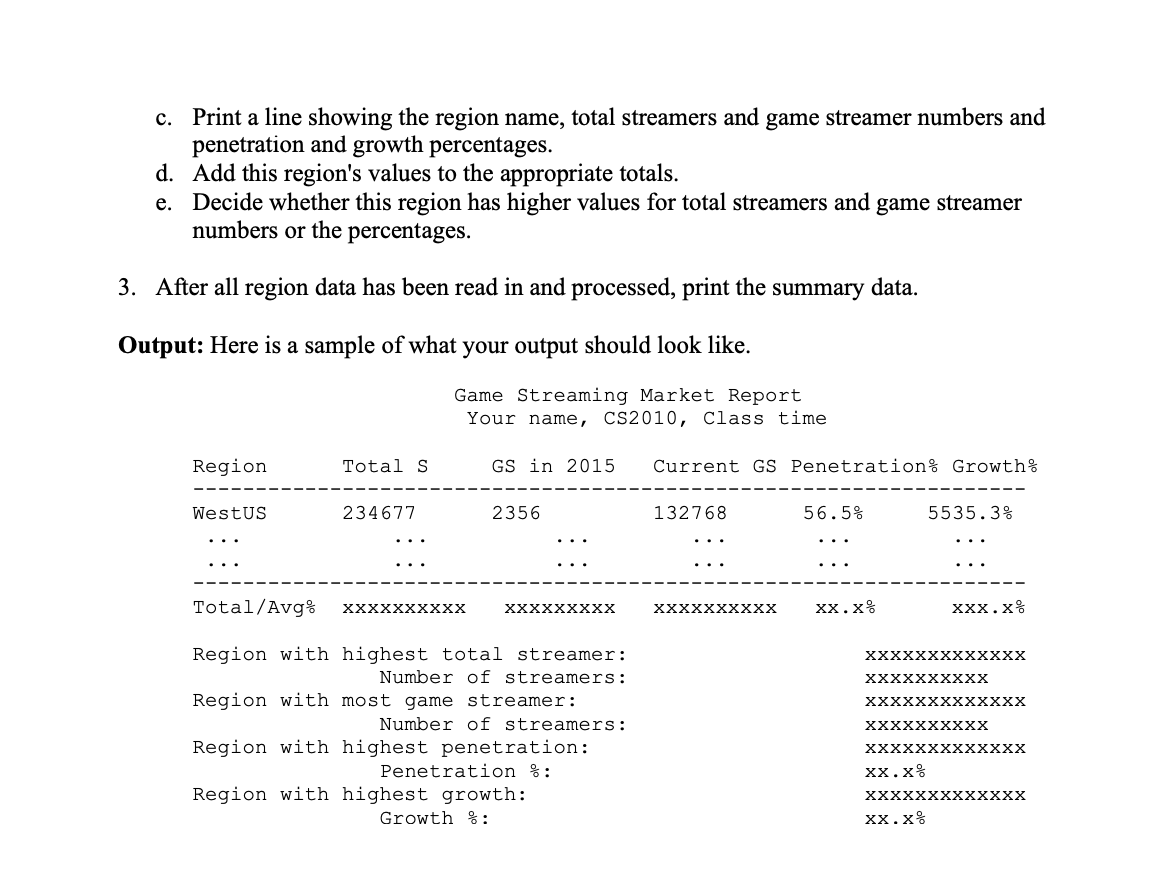
CS2010 Program 4: Game Streaming Market Analysis Program description: Write a Visual C++ program to read in Game Streaming Market data from a file and create a report to summarize the data. This program gives you practice with using text files for input and output. You will also use looping algorithms for finding a total, average, and highest value. When you are ready to type in your program, create a new CH project in Visual Studio using your last name, first initial and pgm4 as the project name and C++ file name (e.g., LastF_pgm4 and LastF_pgm4.cpp). Name the report file your program creates pgm4rpt.txt. Input: The data for each region of the world is stored in a file called pgm4.txt. Your program should read in a region name followed by three numbers representing the total number of streamers in that region, the number of game streamers (GS) in 2015, and the current number of game streamers. After processing the data for one region, your program should read in the data for the next region, and so on. Copy the file pgm4.txt from Canvas into your project folder. The data in the file includes four lines for each region with the region name followed by the three numbers. Assume that you do not know the number of regions ahead of time so your program should be able to handle any amount of data that may be in the file. Note: pay attention to the range of integer numbers, you may have to use the data type of long long int to hold on some very large numbers contained in this file. The first couple of regions look like this: WestUS 234677 2356 132768 Midwest US 672983 Program Processing Steps: 1. Your program should first open the input file (to read the data from) and an output file (to write the report to) and check the success of each of these operations. Also, do any initialization of variables required and print the headings for your report to the output file. 2. Use a while loop to: a. Read in the total number of streamers in that region, the number of game streamers (GS) in 2015, and the current number of game streamers values for a region. b. Find the penetration and growth percentages for the region using the formulas below. current game streamer Penetration %= current game streamer game streamer in 2015 Growth % game streamer in 2015 total streamer c. Print a line showing the region name, total streamers and game streamer numbers and penetration and growth percentages. d. Add this region's values to the appropriate totals. e. Decide whether this region has higher values for total streamers and game streamer numbers or the percentages. 3. After all region data has been read in and processed, print the summary data. Output: Here is a sample of what your output should look like. Game Streaming Market Report Your name, CS2010, Class time Region Total S GS in 2015 Current GS Penetration Growth WestUS 234677 2356 132768 56.5% 5535.3% Total/Avg% xxxxxxxxxx XXXXXXXXX XXXXXXXXXX xx.x% xxx.x% Region with highest total streamer: Number of streamers: Region with most game streamer: Number of streamers: Region with highest penetration: Penetration : Region with highest growth: Growth %: XXXXXXXXXXXXX XXXXXXXXXX xxxxxxxxxxxxx xxxxxxxxxx XXXXXXXXXXXXX xx.x% xxxxxxxxxxxxx xx.x%


