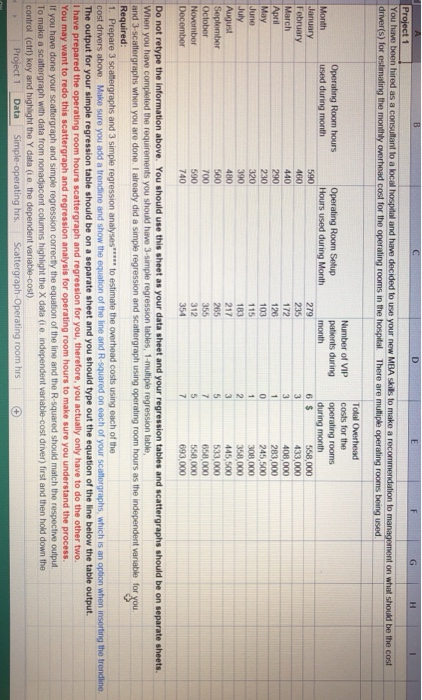
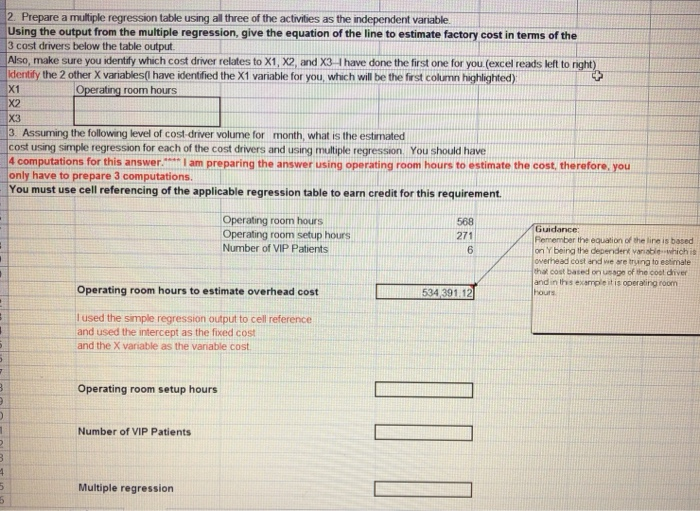
Project 1 on what should be the cost driver(s) for Number of VIPcosts for the Operating Room Setup Hours used during Month Operating Room hours used during month pationts during operating rooms during month 558,000 433,000 08,000 283,000 245,500 6 S February March 172 103 115 183 217 358,000 445,500 533,000 658,000 558,000 693,000 August September October 312 740 December Do not retype the information above. You should use this sheet as your data sheet and your regression tables and scattergraphs should be on separate sheets When you have completed the requirements you should have 3-simple regression tables, 1-multiple regression table and 3-scattergraphs when you are done. I already did a simple regression and scattergraph using operating room hours as the independent variable for you 1. Prepare 3 scattergraphs and 3 simple regression analyses*" to estimate the overhead costs using each of the cost drivers above. Make sure you add a trendline and show the equation of the line and R-squared on each of your scaltergraphs, which is an option when inserting the trendine The output for your simple regression table should be on a separate sheet and you should type out the equation of the line below the table output I have prepared the operating room hours scattergraph and regression for you, therefore, you actually only have to do the other two. You may want to redo this If you have done your scattergraph and simple regression correctly the equation of the line and the R-squared should match the respective output To make a scattergraph with data from ph and regression analysis for operating room hours to make sure you understand the process ent columns highlight the X data (i.e independent variable-cost driver) first and then hold down the h-Operating room hrs 1 Data mple-operating hrs. Scatte 2. Prepare a multiple regression table using all three of the activities as the independent variable Using the output from the multiple regression, give the equation of the line to estimate factory cost in terms of the 3 cost drivers below the table output Also, make sure you identifly which cost driver relates to X1, X2, and X3 I have done the first one for you (excel reads left to right) kdentify the 2 other X variables(I have identfied the X1 variable for you, which will be the first column highlighted) X1 X2 X3 3. Assuming the following level of cost-driver volume for month, what is the estimated cost using simple regression for each of the cost drivers and using multiple regression, You should have 4 computations for this answer. I am only have to prepare 3 computations. preparing the answer using operating room hours to estimate the cost therefore, you You must use cell referencing of the applicable regression table to earn credit for this requirement. Operating room hours Operating room setup hours Number of VIP Patients 568 271 6 Guidance Remember the equation of the line is based on Y being the depenident variable-which is overhead cost and we are trying to estimale that cost based on ueage of the cost driver and in Ihs exarmpleit is operalting room hours Operating room hours to estimate overhead cost 534,391.12 I used the simple regression output to cell reference and used the intercept as the fixed cost and the X variable as the vanriable cost Operating room setup hours Number of VIP Patients Multiple regression 4 Using the simple and multiple regression analyses above, what independent variablefs) would you recommend to estimate the Overhead Costs? Why? Your response should be at least 75 words and discuss the R-Squared Data Proie Project 1 on what should be the cost driver(s) for Number of VIPcosts for the Operating Room Setup Hours used during Month Operating Room hours used during month pationts during operating rooms during month 558,000 433,000 08,000 283,000 245,500 6 S February March 172 103 115 183 217 358,000 445,500 533,000 658,000 558,000 693,000 August September October 312 740 December Do not retype the information above. You should use this sheet as your data sheet and your regression tables and scattergraphs should be on separate sheets When you have completed the requirements you should have 3-simple regression tables, 1-multiple regression table and 3-scattergraphs when you are done. I already did a simple regression and scattergraph using operating room hours as the independent variable for you 1. Prepare 3 scattergraphs and 3 simple regression analyses*" to estimate the overhead costs using each of the cost drivers above. Make sure you add a trendline and show the equation of the line and R-squared on each of your scaltergraphs, which is an option when inserting the trendine The output for your simple regression table should be on a separate sheet and you should type out the equation of the line below the table output I have prepared the operating room hours scattergraph and regression for you, therefore, you actually only have to do the other two. You may want to redo this If you have done your scattergraph and simple regression correctly the equation of the line and the R-squared should match the respective output To make a scattergraph with data from ph and regression analysis for operating room hours to make sure you understand the process ent columns highlight the X data (i.e independent variable-cost driver) first and then hold down the h-Operating room hrs 1 Data mple-operating hrs. Scatte 2. Prepare a multiple regression table using all three of the activities as the independent variable Using the output from the multiple regression, give the equation of the line to estimate factory cost in terms of the 3 cost drivers below the table output Also, make sure you identifly which cost driver relates to X1, X2, and X3 I have done the first one for you (excel reads left to right) kdentify the 2 other X variables(I have identfied the X1 variable for you, which will be the first column highlighted) X1 X2 X3 3. Assuming the following level of cost-driver volume for month, what is the estimated cost using simple regression for each of the cost drivers and using multiple regression, You should have 4 computations for this answer. I am only have to prepare 3 computations. preparing the answer using operating room hours to estimate the cost therefore, you You must use cell referencing of the applicable regression table to earn credit for this requirement. Operating room hours Operating room setup hours Number of VIP Patients 568 271 6 Guidance Remember the equation of the line is based on Y being the depenident variable-which is overhead cost and we are trying to estimale that cost based on ueage of the cost driver and in Ihs exarmpleit is operalting room hours Operating room hours to estimate overhead cost 534,391.12 I used the simple regression output to cell reference and used the intercept as the fixed cost and the X variable as the vanriable cost Operating room setup hours Number of VIP Patients Multiple regression 4 Using the simple and multiple regression analyses above, what independent variablefs) would you recommend to estimate the Overhead Costs? Why? Your response should be at least 75 words and discuss the R-Squared Data Proie


