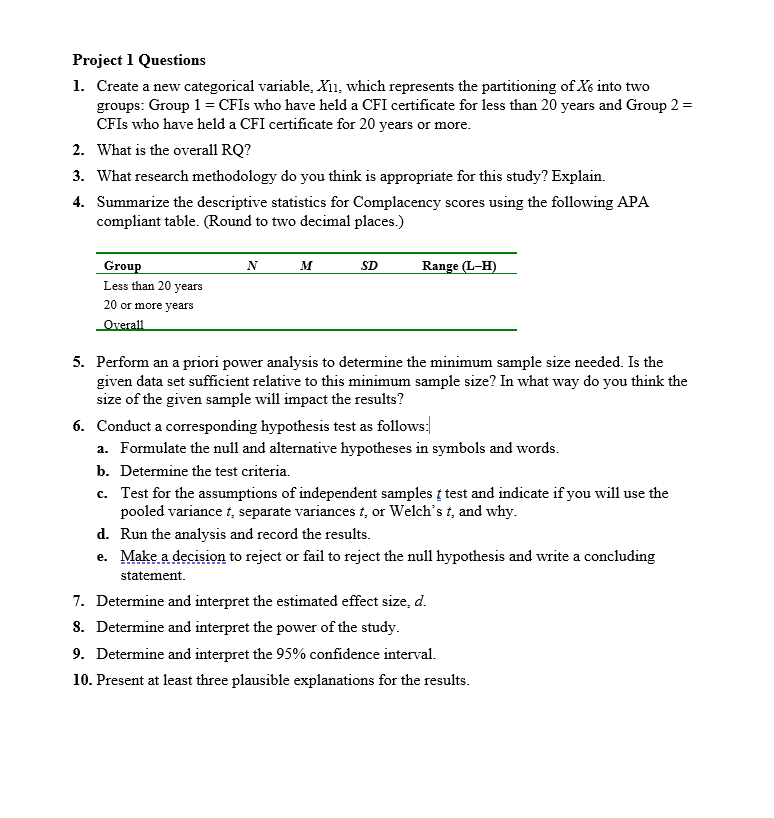
Answered step by step
Verified Expert Solution
Link Copied!

Question

1 Approved Answer

Project 1 uses actual research data collected from a random sample of N = 340 certified flight instructors (CFIs). This dataset is given as the

Project 1 uses actual research data collected from a random sample ofN= 340 certified flight instructors (CFIs). This dataset is given as the Excel file"Week9-ResearchProject 2A Data."

As a reminder, the initialdata set consists of the following 10 independent variables (IVs) and one dependentvariable (DV):

X1=Participants'gender

X2 = Participants' age in yearsX3 =Participants' race/ethnicityX4=Participants'maritalstatus

X5=Participants' highest level of education

X6=Totalyears participants haveheld a CFIcertificate

X7=Participants'total hoursdualgiven

X8=Participants'totalhoursdualgiveninprevious90days

X9=Participants'totalflighttime(inhours)

X10=Typesofcertificatesparticipantscurrenthold

Y= Complacency scores, which weremeasured on a 7-?item Likert scale ranging from 1 = Strongly Disagree to 5 = Strongly Agree. Thus, scores could rangefrom 7 to 35, with higher scores indicating a greater likelihood towardcomplacencyasaflight instructor.

image text in transcribed
Project 1 Questions 1. Create a new categorical variable, Yil, which represents the partitioning of X6 into two groups: Group 1 = CFIs who have held a CFI certificate for less than 20 years and Group 2 = CFIs who have held a CFI certificate for 20 years or more. 2. What is the overall RQ? 3. What research methodology do you think is appropriate for this study? Explain. 4. Summarize the descriptive statistics for Complacency scores using the following APA compliant table. (Round to two decimal places.) Group N M SD Range (L-H) Less than 20 years 20 or more years Overall 5. Perform an a priori power analysis to determine the minimum sample size needed. Is the given data set sufficient relative to this minimum sample size? In what way do you think the size of the given sample will impact the results? 6. Conduct a corresponding hypothesis test as follows: a. Formulate the null and alternative hypotheses in symbols and words. b. Determine the test criteria c. Test for the assumptions of independent samples { test and indicate if you will use the pooled variance t, separate variances t, or Welch's t, and why. d. Run the analysis and record the results. e. Make a decision to reject or fail to reject the null hypothesis and write a concluding statement. 7. Determine and interpret the estimated effect size, d. 8. Determine and interpret the power of the study. 9. Determine and interpret the 95% confidence interval. 10. Present at least three plausible explanations for the results

Step by Step Solution

There are 3 Steps involved in it

Step: 1

blur-text-image

Get Instant Access to Expert-Tailored Solutions

See step-by-step solutions with expert insights and AI powered tools for academic success

Step: 2

blur-text-image

Step: 3

blur-text-image

Ace Your Homework with AI

Get the answers you need in no time with our AI-driven, step-by-step assistance

Get Started

Recommended Textbook for

More Books

Students also viewed these Mathematics questions