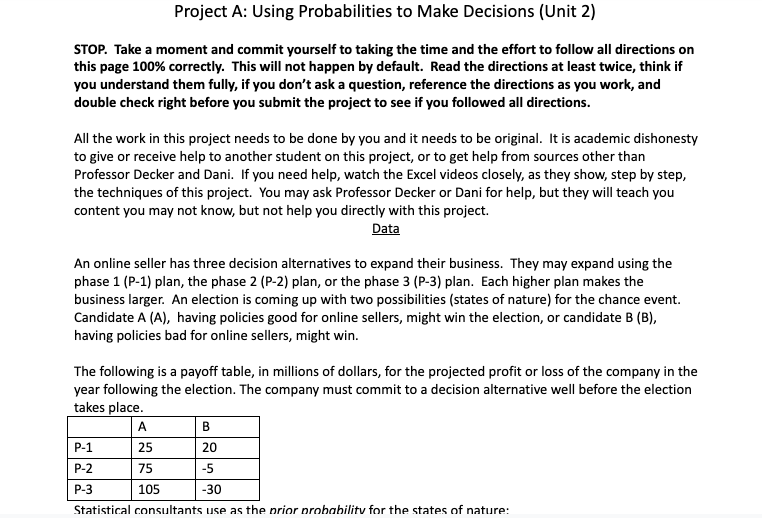
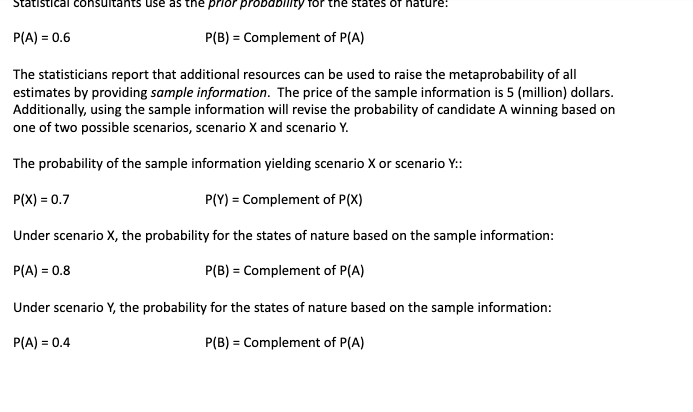
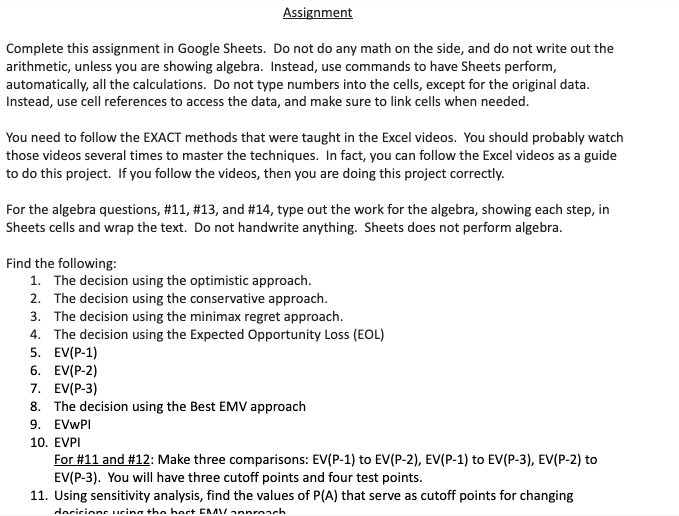
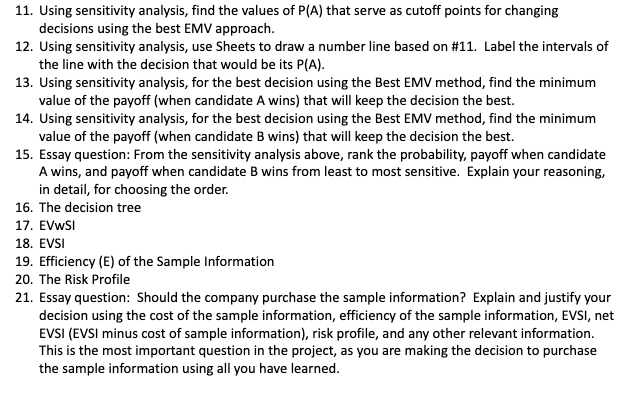
Project A: Using Probabilities to Make Decisions [Unit 2} STOP. Talrae a moment and commit yourself to taking the time and the effort to follow all directions on this page 1m correctly. This 1will not happen by default. Read the directions at least t'IIiII'ice,r think if you understand them fully,r if you don't ask a question, reference the directions as you work, and double check right before you submit the project to see if you followed all directions. All the work in this project needs to be done by you and it needs to be original. It is academic dishonesty to give or receive help to another student on this project, or to get help from sources other than Professor Decker and Dani. If you need help, watch the Excel videos closely, as they show, step by step, the techniques of this project. 'I'ou may ask Professor Decker or Dani for help, but they will teach you content you may not know, but not help you directly with this project. Data An online seller has three decision alternatives to expand their business. They may expand using the phase 1 jP-lj plan, the phase 2 jP-Z} plan, or the phase 3 jP-Bj plan. Each higher plan makes the business larger. An election is coming up with two possibilities [states of nature:- for the chance event. Candidate A {A}, having policies good for online sellers, might win the election, or candidate B {B}, having policies bad for online sellers, might win. The following is a payoff table, in millions of dollars, for the projected prot or loss of the company in the year following the election. The company must commit to a decision alternative well before the election takes place. Statistical consultants use as the. prior nmhabilitv fur the states of nature: Statistical consultants use as the prior probability for the states of nature: P(A) = 0.6 P(B) = Complement of P(A) The statisticians report that additional resources can be used to raise the metaprobability of all estimates by providing sample information. The price of the sample information is 5 (million) dollars. Additionally, using the sample information will revise the probability of candidate A winning based on one of two possible scenarios, scenario X and scenario Y. The probability of the sample information yielding scenario X or scenario Y:: P(X) = 0.7 P(Y) = Complement of P(X) Under scenario X, the probability for the states of nature based on the sample information: P(A) = 0.8 P(B) = Complement of P(A) Under scenario Y, the probability for the states of nature based on the sample information: P(A) = 0.4 P(B) = Complement of P(A)Assignment Complete this assignment in Google Sheets. Do not do any math on the side, and do not write out the arithmetic, unless you are showing algebra. Instead, use commands to have Sheets perform, automatically, all the calculations. Do not type numbers into the cells, except for the original data. Instead, use cell references to access the data, and make sure to link cells when needed. You need to follow the EXACT methods that were taught in the Excel videos. You should probably watch those videos several times to master the techniques. In fact, you can follow the Excel videos as a guide to do this project. If you follow the videos, then you are doing this project correctly. For the algebra questions, #11, #13, and #14, type out the work for the algebra, showing each step, in Sheets cells and wrap the text. Do not handwrite anything. Sheets does not perform algebra. Find the following: 1. The decision using the optimistic approach. 2. The decision using the conservative approach. 3. The decision using the minimax regret approach. 4. The decision using the Expected Opportunity Loss (EOL) 5. EV(P-1) 6. EV(P-2) 7. EV(P-3) 8. The decision using the Best EMV approach 9. EVWPI 10. EVPI For #11 and #12: Make three comparisons: EV(P-1) to EV(P-2), EV(P-1) to EV(P-3), EV(P-2) to EV(P-3). You will have three cutoff points and four test points. 11. Using sensitivity analysis, find the values of P(A) that serve as cutoff points for changing iring tha hart FLY anArm11. Using sensitivity analysis, find the values of P(A) that serve as cutoff points for changing decisions using the best EMV approach. 12. Using sensitivity analysis, use Sheets to draw a number line based on #11. Label the intervals of the line with the decision that would be its P(A). 13. Using sensitivity analysis, for the best decision using the Best EMV method, find the minimum value of the payoff (when candidate A wins) that will keep the decision the best. 14. Using sensitivity analysis, for the best decision using the Best EMV method, find the minimum value of the payoff (when candidate B wins) that will keep the decision the best. 15. Essay question: From the sensitivity analysis above, rank the probability, payoff when candidate A wins, and payoff when candidate B wins from least to most sensitive. Explain your reasoning, in detail, for choosing the order. 16. The decision tree 17. EVWSI 18. EVSI 19. Efficiency (E) of the Sample Information 20. The Risk Profile 21. Essay question: Should the company purchase the sample information? Explain and justify your decision using the cost of the sample information, efficiency of the sample information, EVSI, net EVSI (EVSI minus cost of sample information), risk profile, and any other relevant information. This is the most important question in the project, as you are making the decision to purchase the sample information using all you have learned


