Project Approval Project / New iphone12 (
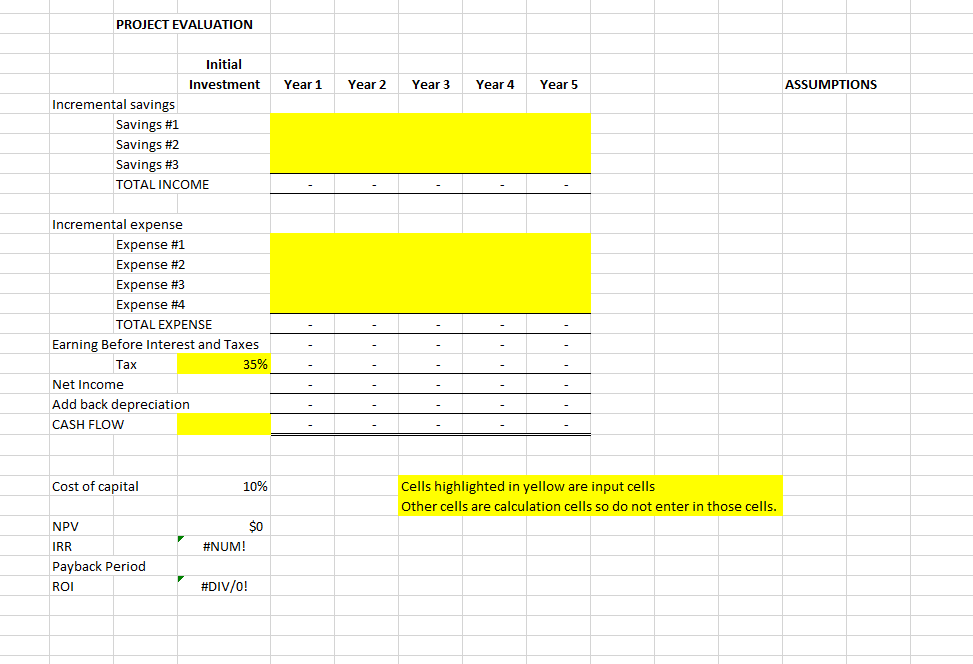
- Five-year cash flow ( if possible, pls. work in excel. I need 5 year-cash flow )
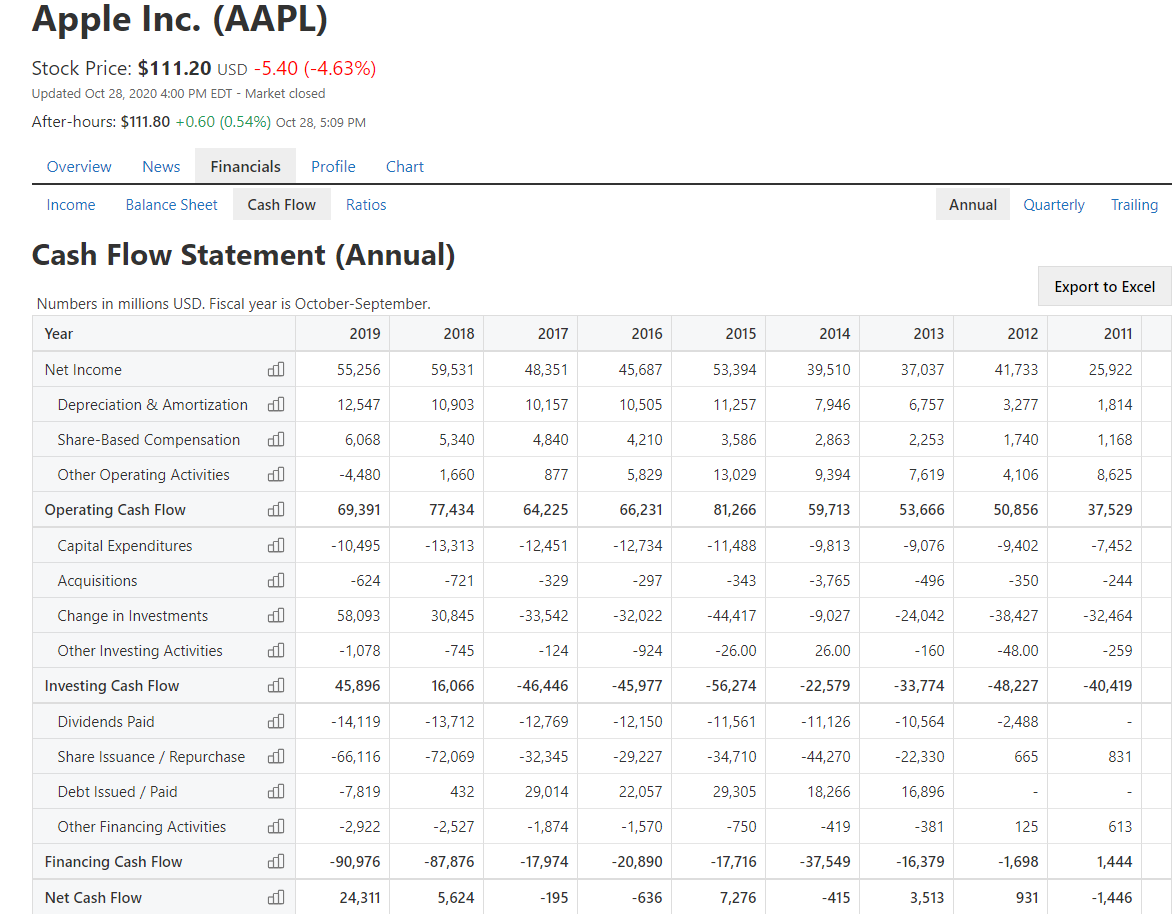
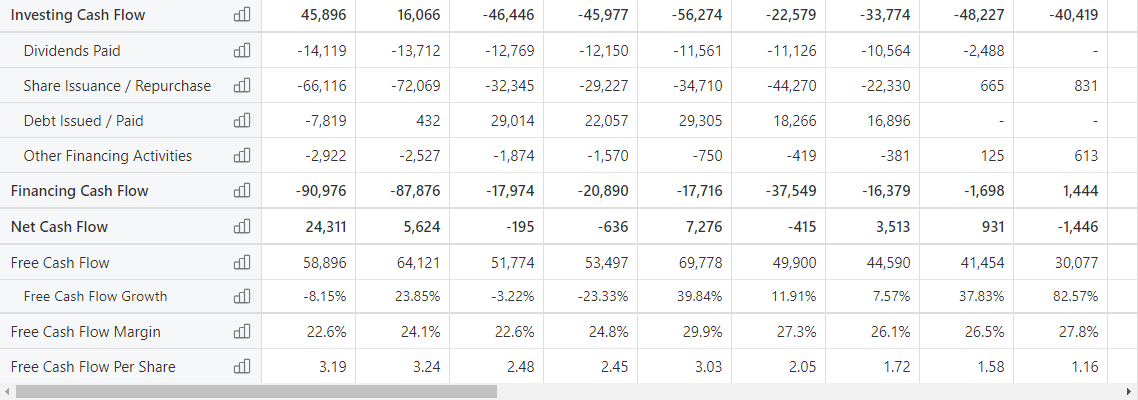
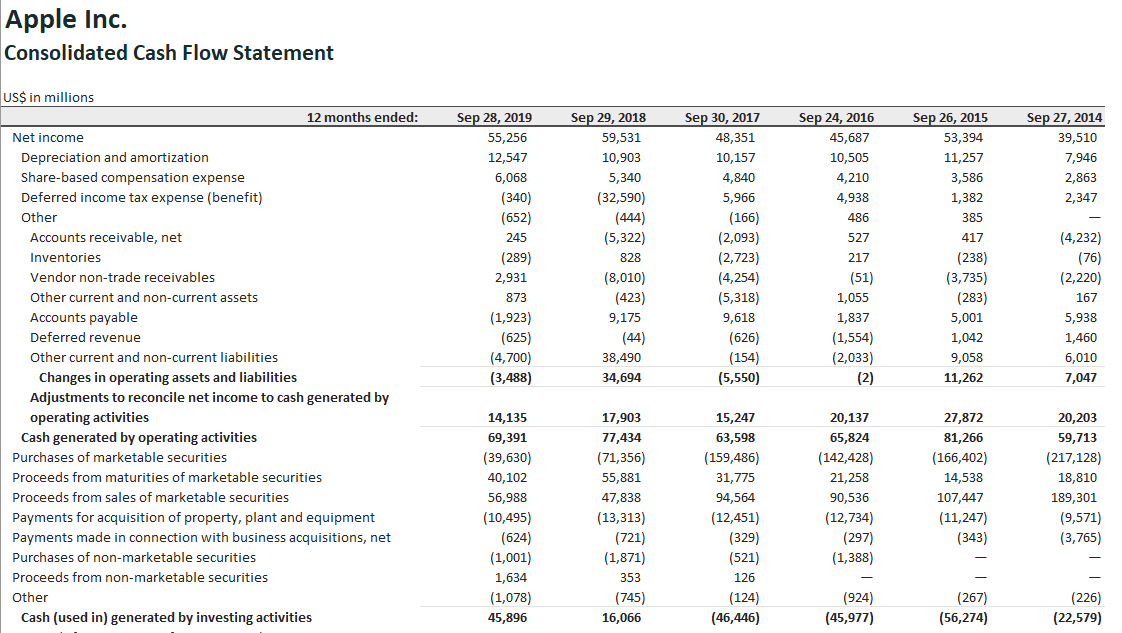
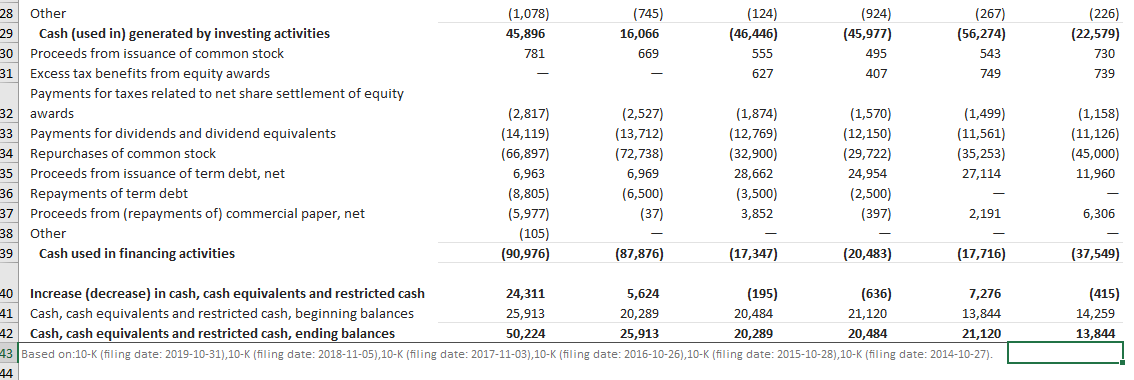
PROJECT EVALUATION Year 1 Year 2 Year 3 Year 4 Year 5 ASSUMPTIONS Initial Investment Incremental savings Savings #1 Savings #2 Savings #3 TOTAL INCOME Incremental expense Expense #1 Expense #2 Expense #3 Expense #4 TOTAL EXPENSE Earning Before Interest and Taxes Tax 35% Net Income Add back depreciation CASH FLOW Cost of capital 10% Cells highlighted in yellow are input cells Other cells are calculation cells so do not enter in those cells. $0 #NUM! NPV IRR Payback Period ROI #DIV/0! Apple Inc. (AAPL) Stock Price: $111.20 USD -5.40 (-4.63%) Updated Oct 28, 2020 4:00 PM EDT - Market closed After-hours: $111.80 +0.60 (0.54%) Oct 28, 5:09 PM Overview News Financials Profile Chart Income Balance Sheet Cash Flow Ratios Annual Quarterly Trailing Cash Flow Statement (Annual) Export to Excel Numbers in millions USD. Fiscal year is October September. Year 2019 2018 2017 2016 2015 2014 2013 2012 2011 Net Income 55,256 59,531 48,351 45,687 53,394 39,510 37,037 41,733 25,922 Depreciation & Amortization al 12,547 10,903 10,157 10,505 11,257 7,946 6,757 3,277 1,814 Share-Based Compensation 6,068 5,340 4,840 4,210 3,586 2,863 2,253 1,740 1,168 Other Operating Activities -4,480 1,660 877 5,829 13,029 9,394 7,619 4,106 8,625 Operating Cash Flow 69,391 77,434 64,225 66,231 81,266 59,713 53,666 50,856 37,529 Capital Expenditures - 10,495 -13,313 -12,451 -12,734 -11,488 -9,813 -9,076 -9,402 -7,452 mmmmmmmmm Acquisitions -624 -721 -329 -297 -343 -3,765 -496 -350 -244 Change in Investments 58,093 30,845 -33,542 -32,022 -44,417 -9,027 -24,042 -38,427 -32,464 Other Investing Activities - 1,078 -745 -124 -924 -26.00 26.00 - 160 - 48.00 -259 Investing Cash Flow 45,896 16,066 -46,446 -45,977 -56,274 -22,579 -33,774 -48,227 -40,419 Dividends Paid -14,119 - 13,712 -12,769 -12,150 -11,561 -11,126 -10,564 -2,488 Share Issuance / Repurchase -66,116 -72,069 -32,345 -29,227 -34,710 -44,270 -22,330 665 831 Debt Issued / Paid -7,819 432 29,014 22,057 29,305 18,266 16,896 Other Financing Activities -2,922 -2,527 -1,874 -1,570 -750 -419 -381 125 613 9999 Financing Cash Flow -90,976 -87,876 - 17,974 -20,890 -17,716 -37,549 -16,379 -1,698 1,444 Net Cash Flow 24,311 5,624 -195 -636 7,276 -415 3,513 931 -1,446 Investing Cash Flow 45,896 16,066 -46,446 -45,977 -56,274 -22,579 -33,774 -48,227 -40,419 Dividends Paid -14,119 -13,712 -12,769 -12,150 -11,561 -11,126 -10,564 -2,488 Share Issuance / Repurchase -66,116 -72,069 -32,345 -29,227 -34,710 -44,270 -22,330 665 831 Debt Issued / Paid -7,819 432 29,014 22,057 29,305 18,266 16,896 Other Financing Activities -2,922 -2,527 -1,874 -1,570 -750 -419 -381 125 613 Financing Cash Flow -90,976 -87,876 -17,974 -20,890 -17,716 -37,549 -16,379 -1,698 1,444 3 3 3 3 9 Net Cash Flow 24,311 5,624 -195 -636 7,276 -415 3,513 931 -1,446 Free Cash Flow 58,896 64,121 51,774 53,497 69,778 49,900 44,590 41,454 30,077 Free Cash Flow Growth -8.15% 23.85% -3.22% -23.33% 39.84% 11.91% 7.57% 37.83% 82.57% Free Cash Flow Margin 22.6% 24.1% 22.6% 24.8% 29.9% 27.3% 26.1% 26.5% 27.8% Free Cash Flow Per Share 3.19 3.24 2.48 2.45 3.03 2.05 1.72 1.58 1.16 Apple Inc. Consolidated Cash Flow Statement Sep 27, 2014 39,510 7,946 2,863 2,347 US$ in millions 12 months ended: Net income Depreciation and amortization Share-based compensation expense Deferred income tax expense (benefit) Other Accounts receivable, net Inventories Vendor non-trade receivables Other current and non-current assets Accounts payable Deferred revenue Other current and non-current liabilities Changes in operating assets and liabilities Adjustments to reconcile net income to cash generated by operating activities Cash generated by operating activities Purchases of marketable securities Proceeds from maturities of marketable securities Proceeds from sales of marketable securities Payments for acquisition of property, plant and equipment Payments made in connection with business acquisitions, net Purchases of non-marketable securities Proceeds from non-marketable securities Sep 28, 2019 55,256 12,547 6,068 (340) (652) 245 (289) 2,931 873 (1,923) (625) (4,700) (3,488) Sep 29, 2018 59,531 10,903 5,340 (32,590) (444) (5,322) 828 (8,010) (423) 9,175 (44) 38,490 34,694 Sep 30, 2017 48,351 10,157 4,840 5,966 (166) (2,093) (2,723) (4,254) (5,318) 9,618 (626) (154) (5,550) Sep 24, 2016 45,687 10,505 4,210 4,938 486 527 217 (51) 1,055 1,837 (1,554) (2,033) (2) Sep 26, 2015 53,394 11,257 3,586 1,382 385 417 (238) (3,735) (283) 5,001 1,042 9,058 11,262 (4,232) (76) (2,220) 167 5,938 1,460 6,010 7,047 14,135 69,391 (39,630) 40,102 56,988 (10,495) (624) (1,001) 1,634 (1,078) 45,896 17,903 77,434 (71,356) 55,881 47,838 (13,313) (721) (1,871) 353 (745) 16,066 15,247 63,598 (159,486) 31,775 94,564 (12,451) (329) (521) 126 (124) (46,446) 20,137 65,824 (142,428) 21,258 90,536 (12,734) (297) (1,388) 27,872 81,266 (166,402) 14,538 107,447 (11,247) (343) 20,203 59,713 (217,128) 18,810 189,301 (9,571) (3,765) Other (924) (45,977) (267) (56,274) (226) (22,579) Cash (used in) generated by investing activities (226) (22,579) 730 739 (1,158) (11,126) (45,000) 11,960 28 Other (1,078) (745) (124) (924) (267) 29 Cash (used in) generated by investing activities 45,896 16,066 (46,446) (45,977) (56,274) 30 Proceeds from issuance of common stock 781 669 555 495 543 31 Excess tax benefits from equity awards 627 407 749 Payments for taxes related to net share settlement of equity 32 awards (2,817) (2,527) (1,874) (1,570) (1,499) 33 Payments for dividends and dividend equivalents (14,119) (13,712) (12,769) (12,150) (11,561) 34 Repurchases of common stock (66,897) (72,738) (32,900) (29,722) (35,253) 35 Proceeds from issuance of term debt, net 6,963 6,969 28,662 24,954 27,114 36 Repayments of term debt (8,805) (6,500) (3,500) (2,500) 37 Proceeds from (repayments of) commercial paper, net (5,977) (37) 3,852 (397) 2,191 38 Other (105) 39 Cash used in financing activities (90,976) (87,876) (17,347) (20,483) (17,716) 40 Increase (decrease) in cash, cash equivalents and restricted cash 24,311 5,624 (195) (636) 7,276 41 Cash, cash equivalents and restricted cash, beginning balances 25,913 20,289 20,484 21,120 13,844 42 Cash, cash equivalents and restricted cash, ending balances 50,224 25,913 20,289 20,484 21,120 43 Based on:10-K (filing date: 2019-10-31),10-K (filing date: 2018-11-05),10-K (filing date: 2017-11-03), 10-K (filing date: 2016-10-26),10-K (filing date: 2015-10-28),10-K (filing date: 2014-10-27). 44 6,306 (37,549) (415) 14,259 13,844 PROJECT EVALUATION Year 1 Year 2 Year 3 Year 4 Year 5 ASSUMPTIONS Initial Investment Incremental savings Savings #1 Savings #2 Savings #3 TOTAL INCOME Incremental expense Expense #1 Expense #2 Expense #3 Expense #4 TOTAL EXPENSE Earning Before Interest and Taxes Tax 35% Net Income Add back depreciation CASH FLOW Cost of capital 10% Cells highlighted in yellow are input cells Other cells are calculation cells so do not enter in those cells. $0 #NUM! NPV IRR Payback Period ROI #DIV/0! Apple Inc. (AAPL) Stock Price: $111.20 USD -5.40 (-4.63%) Updated Oct 28, 2020 4:00 PM EDT - Market closed After-hours: $111.80 +0.60 (0.54%) Oct 28, 5:09 PM Overview News Financials Profile Chart Income Balance Sheet Cash Flow Ratios Annual Quarterly Trailing Cash Flow Statement (Annual) Export to Excel Numbers in millions USD. Fiscal year is October September. Year 2019 2018 2017 2016 2015 2014 2013 2012 2011 Net Income 55,256 59,531 48,351 45,687 53,394 39,510 37,037 41,733 25,922 Depreciation & Amortization al 12,547 10,903 10,157 10,505 11,257 7,946 6,757 3,277 1,814 Share-Based Compensation 6,068 5,340 4,840 4,210 3,586 2,863 2,253 1,740 1,168 Other Operating Activities -4,480 1,660 877 5,829 13,029 9,394 7,619 4,106 8,625 Operating Cash Flow 69,391 77,434 64,225 66,231 81,266 59,713 53,666 50,856 37,529 Capital Expenditures - 10,495 -13,313 -12,451 -12,734 -11,488 -9,813 -9,076 -9,402 -7,452 mmmmmmmmm Acquisitions -624 -721 -329 -297 -343 -3,765 -496 -350 -244 Change in Investments 58,093 30,845 -33,542 -32,022 -44,417 -9,027 -24,042 -38,427 -32,464 Other Investing Activities - 1,078 -745 -124 -924 -26.00 26.00 - 160 - 48.00 -259 Investing Cash Flow 45,896 16,066 -46,446 -45,977 -56,274 -22,579 -33,774 -48,227 -40,419 Dividends Paid -14,119 - 13,712 -12,769 -12,150 -11,561 -11,126 -10,564 -2,488 Share Issuance / Repurchase -66,116 -72,069 -32,345 -29,227 -34,710 -44,270 -22,330 665 831 Debt Issued / Paid -7,819 432 29,014 22,057 29,305 18,266 16,896 Other Financing Activities -2,922 -2,527 -1,874 -1,570 -750 -419 -381 125 613 9999 Financing Cash Flow -90,976 -87,876 - 17,974 -20,890 -17,716 -37,549 -16,379 -1,698 1,444 Net Cash Flow 24,311 5,624 -195 -636 7,276 -415 3,513 931 -1,446 Investing Cash Flow 45,896 16,066 -46,446 -45,977 -56,274 -22,579 -33,774 -48,227 -40,419 Dividends Paid -14,119 -13,712 -12,769 -12,150 -11,561 -11,126 -10,564 -2,488 Share Issuance / Repurchase -66,116 -72,069 -32,345 -29,227 -34,710 -44,270 -22,330 665 831 Debt Issued / Paid -7,819 432 29,014 22,057 29,305 18,266 16,896 Other Financing Activities -2,922 -2,527 -1,874 -1,570 -750 -419 -381 125 613 Financing Cash Flow -90,976 -87,876 -17,974 -20,890 -17,716 -37,549 -16,379 -1,698 1,444 3 3 3 3 9 Net Cash Flow 24,311 5,624 -195 -636 7,276 -415 3,513 931 -1,446 Free Cash Flow 58,896 64,121 51,774 53,497 69,778 49,900 44,590 41,454 30,077 Free Cash Flow Growth -8.15% 23.85% -3.22% -23.33% 39.84% 11.91% 7.57% 37.83% 82.57% Free Cash Flow Margin 22.6% 24.1% 22.6% 24.8% 29.9% 27.3% 26.1% 26.5% 27.8% Free Cash Flow Per Share 3.19 3.24 2.48 2.45 3.03 2.05 1.72 1.58 1.16 Apple Inc. Consolidated Cash Flow Statement Sep 27, 2014 39,510 7,946 2,863 2,347 US$ in millions 12 months ended: Net income Depreciation and amortization Share-based compensation expense Deferred income tax expense (benefit) Other Accounts receivable, net Inventories Vendor non-trade receivables Other current and non-current assets Accounts payable Deferred revenue Other current and non-current liabilities Changes in operating assets and liabilities Adjustments to reconcile net income to cash generated by operating activities Cash generated by operating activities Purchases of marketable securities Proceeds from maturities of marketable securities Proceeds from sales of marketable securities Payments for acquisition of property, plant and equipment Payments made in connection with business acquisitions, net Purchases of non-marketable securities Proceeds from non-marketable securities Sep 28, 2019 55,256 12,547 6,068 (340) (652) 245 (289) 2,931 873 (1,923) (625) (4,700) (3,488) Sep 29, 2018 59,531 10,903 5,340 (32,590) (444) (5,322) 828 (8,010) (423) 9,175 (44) 38,490 34,694 Sep 30, 2017 48,351 10,157 4,840 5,966 (166) (2,093) (2,723) (4,254) (5,318) 9,618 (626) (154) (5,550) Sep 24, 2016 45,687 10,505 4,210 4,938 486 527 217 (51) 1,055 1,837 (1,554) (2,033) (2) Sep 26, 2015 53,394 11,257 3,586 1,382 385 417 (238) (3,735) (283) 5,001 1,042 9,058 11,262 (4,232) (76) (2,220) 167 5,938 1,460 6,010 7,047 14,135 69,391 (39,630) 40,102 56,988 (10,495) (624) (1,001) 1,634 (1,078) 45,896 17,903 77,434 (71,356) 55,881 47,838 (13,313) (721) (1,871) 353 (745) 16,066 15,247 63,598 (159,486) 31,775 94,564 (12,451) (329) (521) 126 (124) (46,446) 20,137 65,824 (142,428) 21,258 90,536 (12,734) (297) (1,388) 27,872 81,266 (166,402) 14,538 107,447 (11,247) (343) 20,203 59,713 (217,128) 18,810 189,301 (9,571) (3,765) Other (924) (45,977) (267) (56,274) (226) (22,579) Cash (used in) generated by investing activities (226) (22,579) 730 739 (1,158) (11,126) (45,000) 11,960 28 Other (1,078) (745) (124) (924) (267) 29 Cash (used in) generated by investing activities 45,896 16,066 (46,446) (45,977) (56,274) 30 Proceeds from issuance of common stock 781 669 555 495 543 31 Excess tax benefits from equity awards 627 407 749 Payments for taxes related to net share settlement of equity 32 awards (2,817) (2,527) (1,874) (1,570) (1,499) 33 Payments for dividends and dividend equivalents (14,119) (13,712) (12,769) (12,150) (11,561) 34 Repurchases of common stock (66,897) (72,738) (32,900) (29,722) (35,253) 35 Proceeds from issuance of term debt, net 6,963 6,969 28,662 24,954 27,114 36 Repayments of term debt (8,805) (6,500) (3,500) (2,500) 37 Proceeds from (repayments of) commercial paper, net (5,977) (37) 3,852 (397) 2,191 38 Other (105) 39 Cash used in financing activities (90,976) (87,876) (17,347) (20,483) (17,716) 40 Increase (decrease) in cash, cash equivalents and restricted cash 24,311 5,624 (195) (636) 7,276 41 Cash, cash equivalents and restricted cash, beginning balances 25,913 20,289 20,484 21,120 13,844 42 Cash, cash equivalents and restricted cash, ending balances 50,224 25,913 20,289 20,484 21,120 43 Based on:10-K (filing date: 2019-10-31),10-K (filing date: 2018-11-05),10-K (filing date: 2017-11-03), 10-K (filing date: 2016-10-26),10-K (filing date: 2015-10-28),10-K (filing date: 2014-10-27). 44 6,306 (37,549) (415) 14,259 13,844
