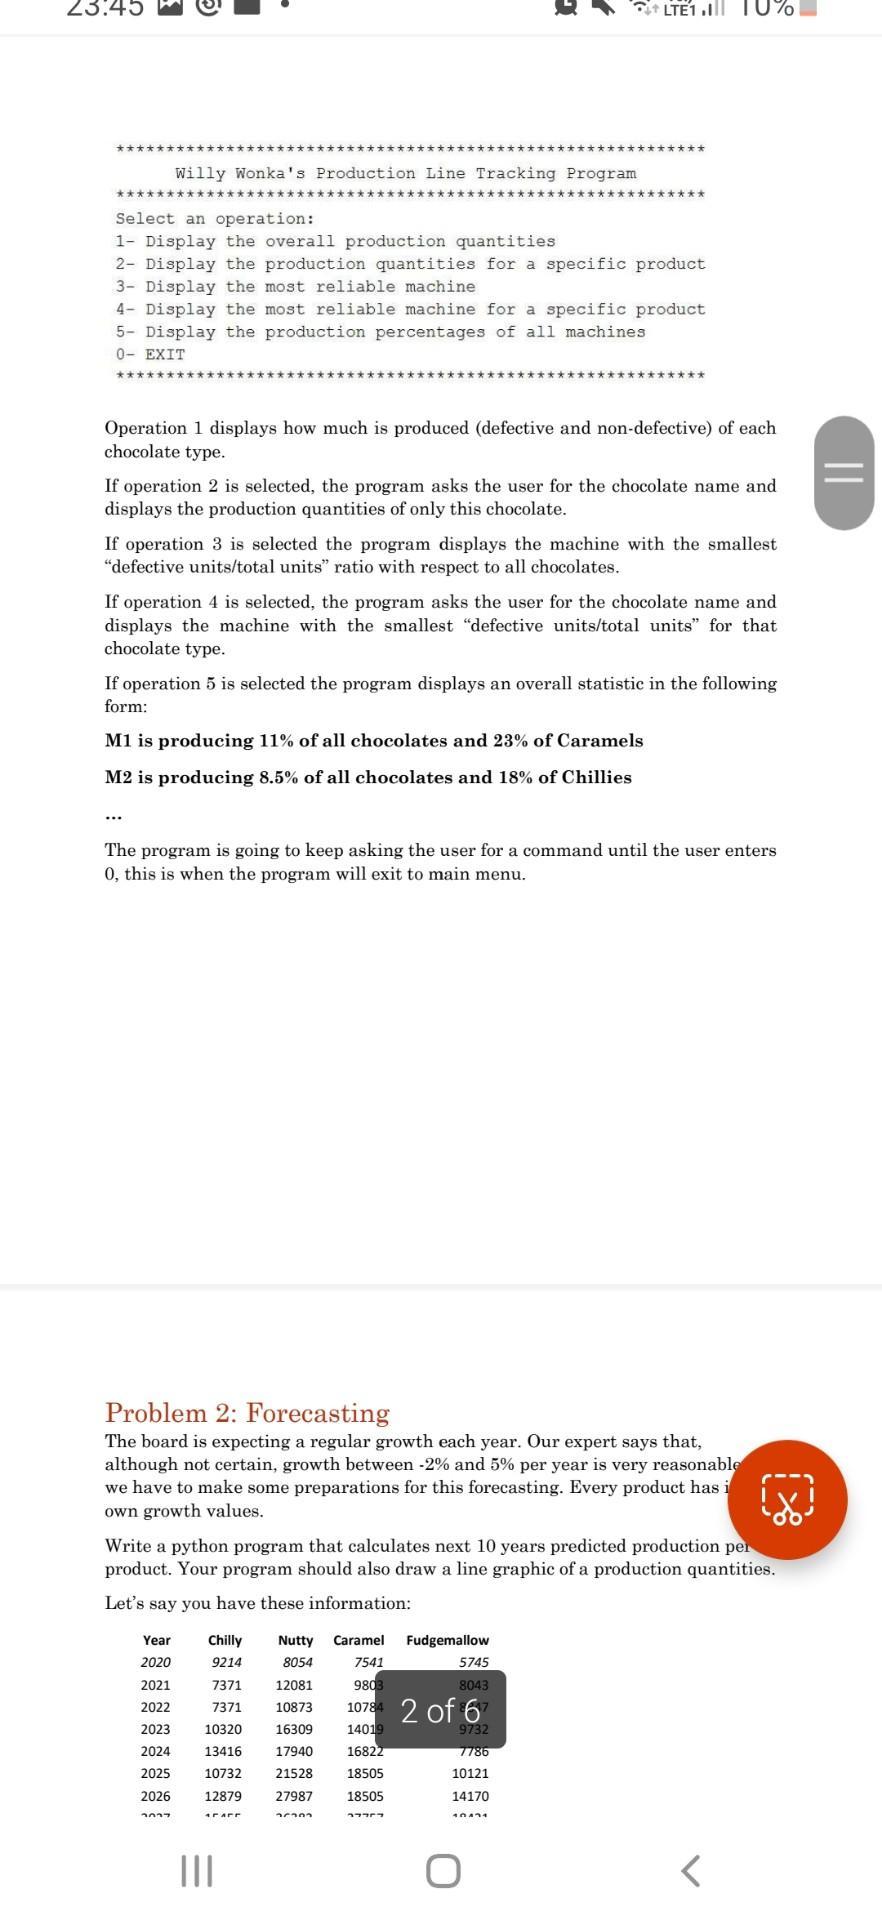
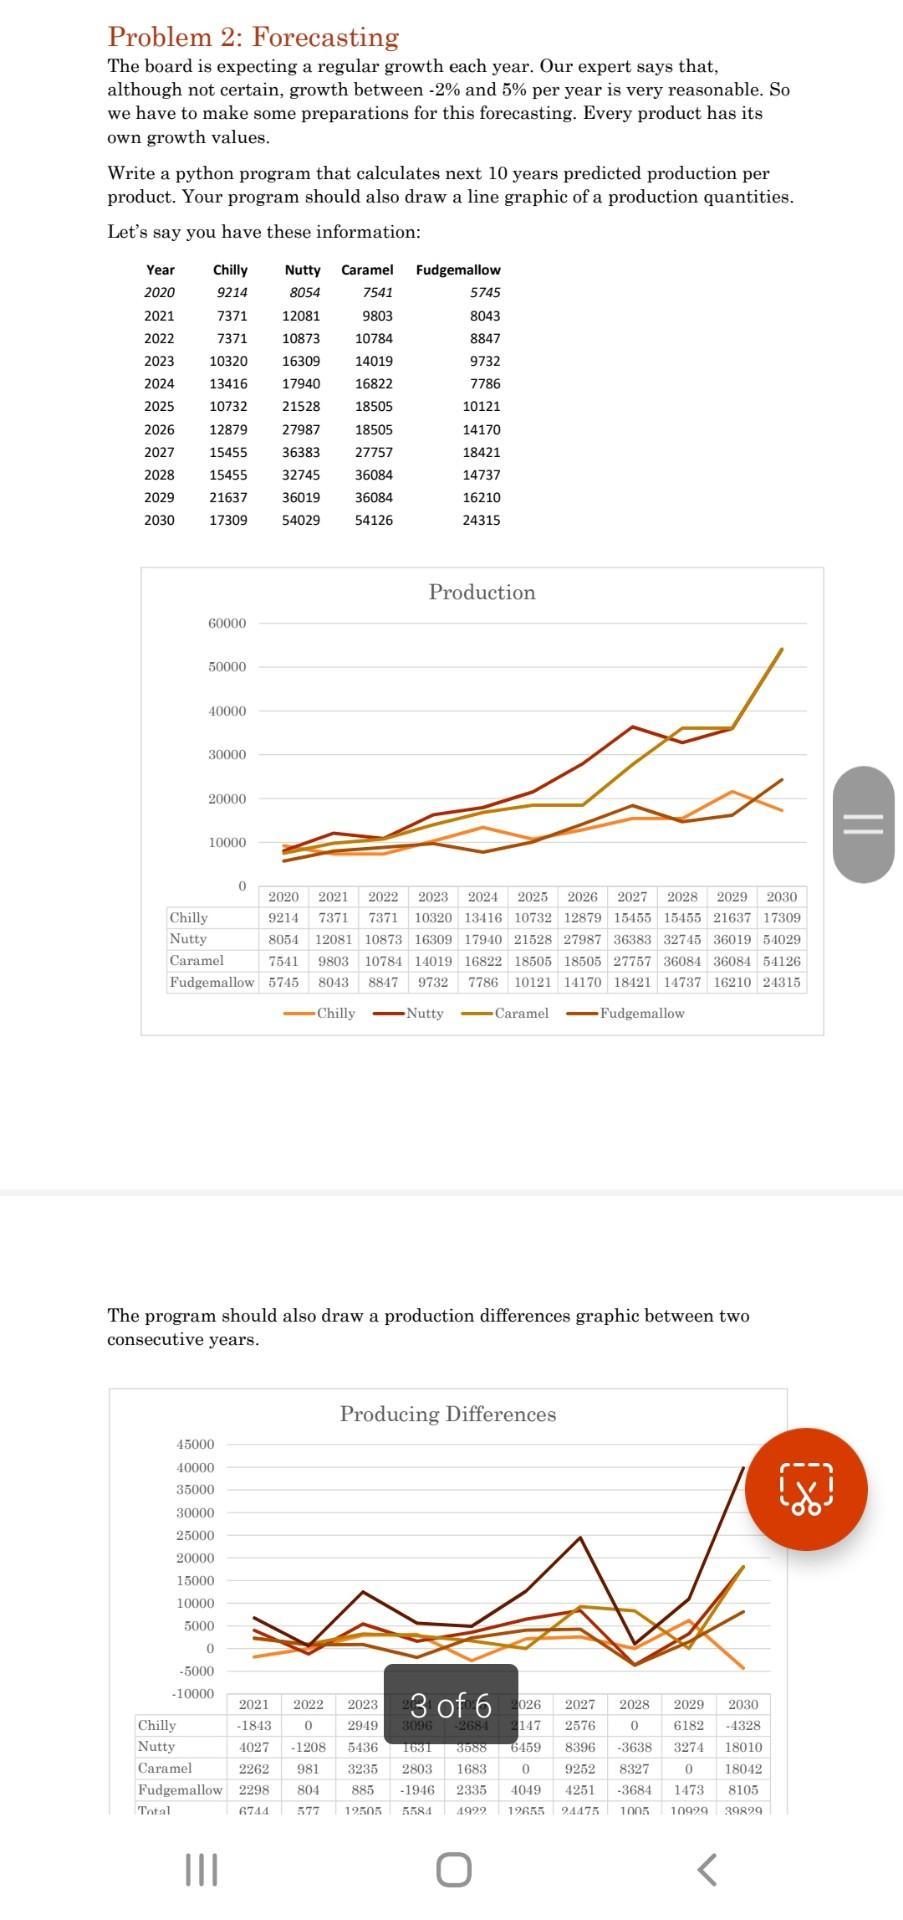
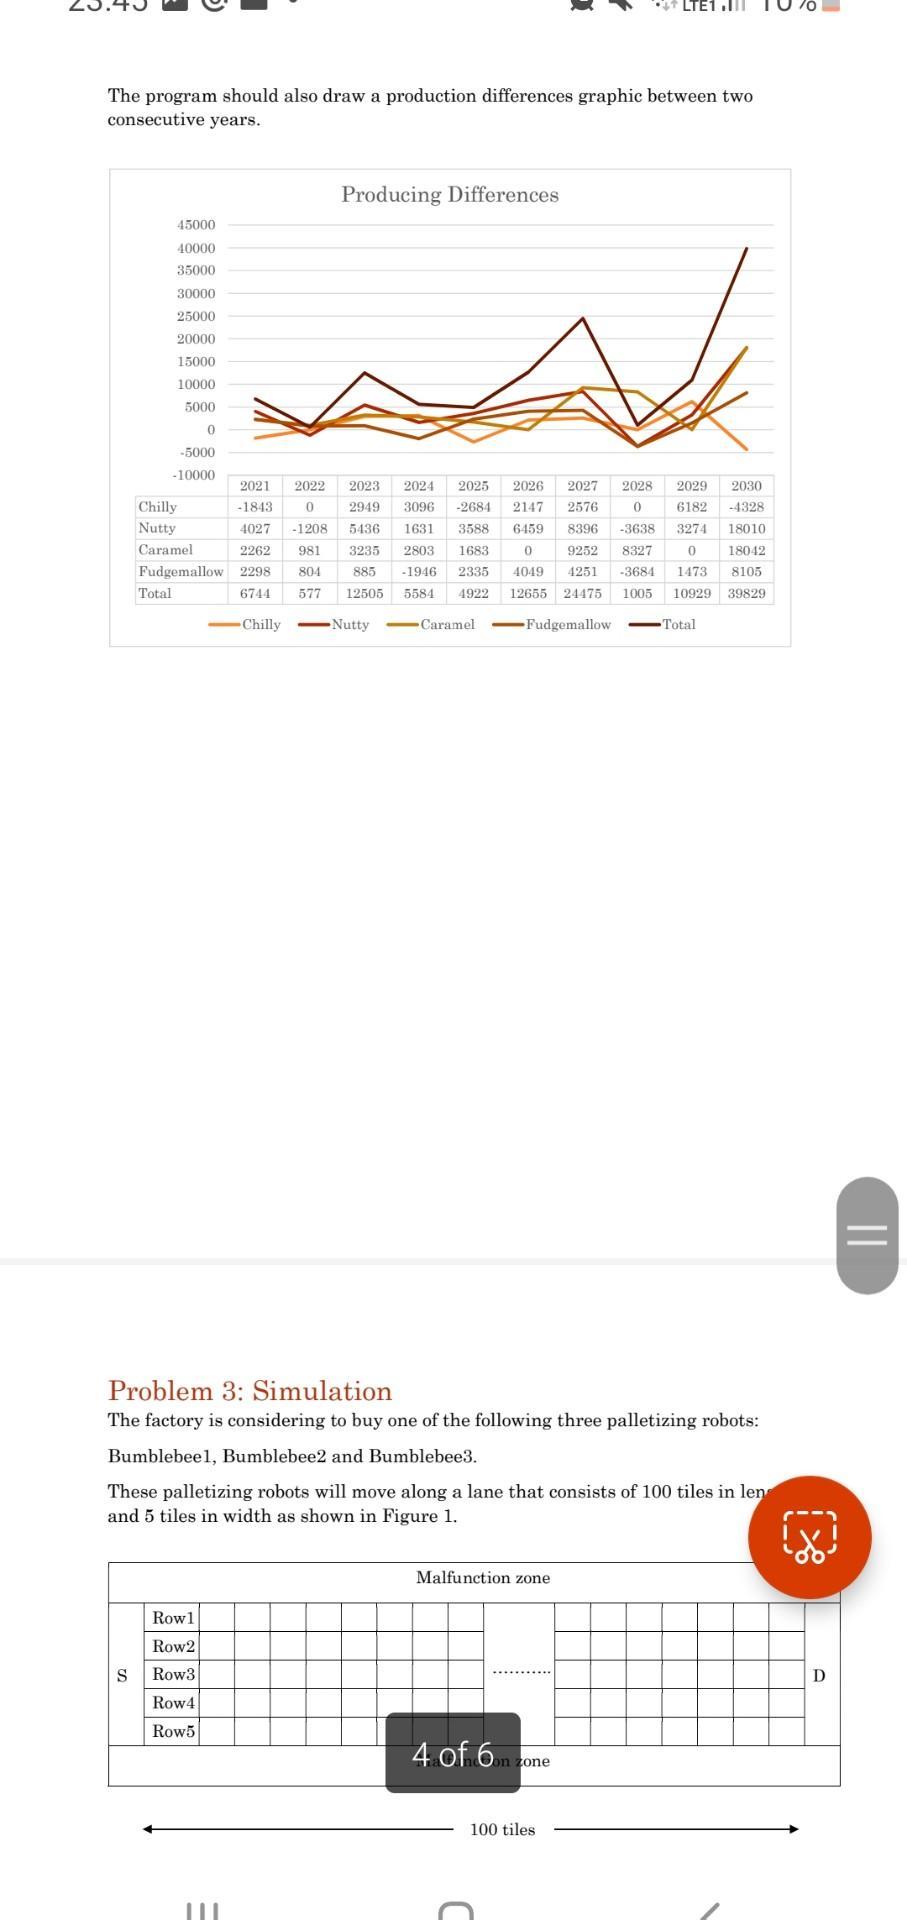
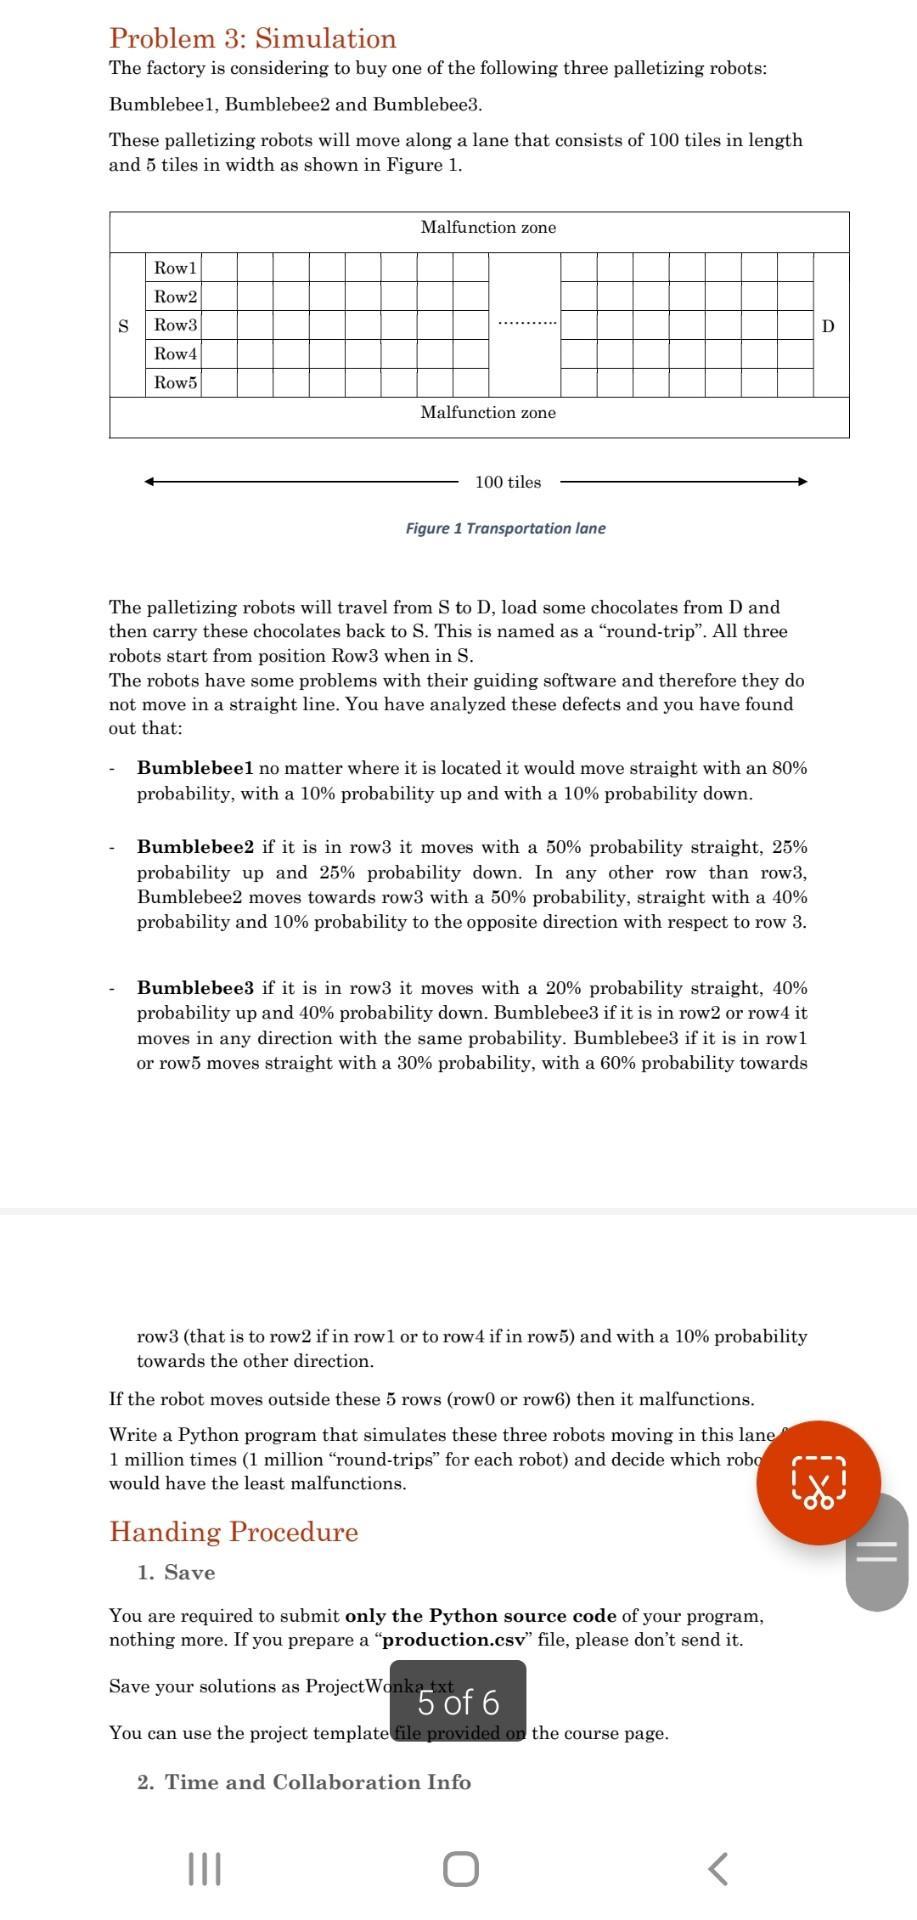
Project Assignment Willy Wonka's Chocolate Factory Due date: 23:59, 6 January 2023 No late submissions are accepted. Problem 1: Productivity You are working as an industrial engineer responsible of the production lines at "Willy Wonka's Chocolate Factory". The factory is producing four types of chocolates (Figure 1), namely Chilly, Nutty, Caramel and Fudgemallow. Each chocolate can be produced by a number of machines (e.g. machines 1,3 and 7 all three of them may produce Caramels). A machine can produce only one type of chocolate (e.g. machines 1, 3 and 7 cannot produce anything else than Caramels). Figure 1 The production information of each machine is stored in a text file named as production.csv. The format of the file is based on records, where each record has the following structure: "Machine name", "Chocolate produced in this machine", "Number of non-defective units produced", "Number of defective units produced" An example of four sequential records from the file is given below: M1, Carame1, 12764, 38 M2, Chilly, 3422, 10 M6, Chilly, 5482, 18 M8, Nutty, 7412, 15 You are required to write a Python program that when starts is going to display the following operations menu to the user: Willy Wonka's Production Line Tracking Program Select an operation: 1- Display the overall production quantities 2- Display the production quantities for a specific product 3- Display the most reliable machine 4- Display the most reliable machine for a specific product 5 - Display the production percentages of all machines 0- EXIT Operation 1 displays how much is produced (defective and non-defective) of each chocolate type. If operation 2 is selected, the program asks the user for the chocolate name and displays the production quantities of only this chocolate. If operation 3 is selected the program displays the machine with the smallest Willy Wonka's Production Line Tracking Program Select an operation: 1- Display the overall production quantities 2- Display the production quantities for a specific product 3- Display the most reliable machine 4- Display the most reliable machine for a specific product 5- Display the production percentages of all machines 0 EXIT Operation 1 displays how much is produced (defective and non-defective) of each chocolate type. If operation 2 is selected, the program asks the user for the chocolate name and displays the production quantities of only this chocolate. If operation 3 is selected the program displays the machine with the smallest "defective units/total units" ratio with respect to all chocolates. If operation 4 is selected, the program asks the user for the chocolate name and displays the machine with the smallest "defective units/total units" for that chocolate type. If operation 5 is selected the program displays an overall statistic in the following form: M1 is producing 11% of all chocolates and 23% of Caramels M2 is producing 8.5% of all chocolates and 18% of Chillies The program is going to keep asking the user for a command until the user enters 0 , this is when the program will exit to main menu. Problem 2: Forecasting The board is expecting a regular growth each year. Our expert says that, although not certain, growth between 2% and 5% per year is very reasonal we have to make some preparations for this forecasting. Every product has own growth values. Write a python program that calculates next 10 years predicted production product. Your program should also draw a line graphic of a production qua Let's say you have these information: Problem 2: Forecasting The board is expecting a regular growth each year. Our expert says that, although not certain, growth between 2% and 5% per year is very reasonable. So we have to make some preparations for this forecasting. Every product has its own growth values. Write a python program that calculates next 10 years predicted production per product. Your program should also draw a line graphic of a production quantities. Let's say you have these information: The program should also draw a production differences graphic between two consecutive years. The program should also draw a production differences graphic between two consecutive years. Problem 3: Simulation The factory is considering to buy one of the following three palletizing robots: Bumblebee1, Bumblebee2 and Bumblebee3. These palletizing robots will move along a lane that consists of 100 tiles in len and 5 tiles in width as shown in Figure 1. Problem 3: Simulation The factory is considering to buy one of the following three palletizing robots: Bumblebee1, Bumblebee2 and Bumblebee3. These palletizing robots will move along a lane that consists of 100 tiles in length and 5 tiles in width as shown in Figure 1. The palletizing robots will travel from S to D, load some chocolates from D and then carry these chocolates back to S. This is named as a "round-trip". All three robots start from position Row3 when in S. The robots have some problems with their guiding software and therefore they do not move in a straight line. You have analyzed these defects and you have found out that: Bumblebee1 no matter where it is located it would move straight with an 80% probability, with a 10% probability up and with a 10% probability down. Bumblebee2 if it is in row3 it moves with a 50% probability straight, 25\% probability up and 25% probability down. In any other row than row3, Bumblebee2 moves towards row3 with a 50% probability, straight with a 40% probability and 10% probability to the opposite direction with respect to row 3 . Bumblebee3 if it is in row3 it moves with a 20% probability straight, 40% probability up and 40% probability down. Bumblebee 3 if it is in row 2 or row 4 it moves in any direction with the same probability. Bumblebee3 if it is in row1 or row5 moves straight with a 30% probability, with a 60% probability towards row3 (that is to row2 if in row1 or to row 4 if in row5) and with a 10% probability towards the other direction. If the robot moves outside these 5 rows (row0 or row6) then it malfunctions. Write a Python program that simulates these three robots moving in this li 1 million times (1 million "round-trips" for each robot) and decide which rol would have the least malfunctions. Handing Procedure 1. Save You are required to submit only the Python source code of your program, nothing more. If you prepare a "production.csv" file, please don't send it. Save your solutions as ProjectWonka 5 of 6 You can use the project template file provided on the course page. 2. Time and Collaboration Info The robots have some problems with their guiding software and therefore they do not move in a straight line. You have analyzed these defects and you have found out that: - Bumblebee1 no matter where it is located it would move straight with an 80% probability, with a 10% probability up and with a 10% probability down. - Bumblebee2 if it is in row3 it moves with a 50% probability straight, 25% probability up and 25% probability down. In any other row than row3, Bumblebee2 moves towards row3 with a 50% probability, straight with a 40% probability and 10% probability to the opposite direction with respect to row 3 . Bumblebee3 if it is in row3 it moves with a 20% probability straight, 40% probability up and 40% probability down. Bumblebee3 if it is in row2 or row4 it moves in any direction with the same probability. Bumblebee3 if it is in row1 or row5 moves straight with a 30% probability, with a 60% probability towards row3 (that is to row2 if in row1 or to row 4 if in row5) and with a 10% probability towards the other direction. If the robot moves outside these 5 rows (row0 or row6) then it malfunctions. Write a Python program that simulates these three robots moving in this lane for 1 million times (1 million "round-trips" for each robot) and decide which robot would have the least malfunctions. Handing Procedure 1. Save You are required to submit only the Python source code of your program, nothing more. If you prepare a "production.csv" file, please don't send it. Save your solutions as ProjectWonka.txt You can use the project template file provided on the course page. 2. Time and Collaboration Info At least 2, up to 4 people can do this assignment together. At the start of the file, in a comment, write down the total number of hours (roughly) you spent on the assignment. Do not forget! For example: \# Willy Wonka Project \# Collaborators Info: \# Names: #................ \# ............... \#. \# IDs: \# XXXXXXXX \# XXXXXXXX \# XXXXXXXX \# Time Spent: h:mm \# ... your code goes here ... If you have any questions about the homework you are required to ask them through our Aybuzem forum. Good luck ()