Answered step by step
Verified Expert Solution
Question
1 Approved Answer
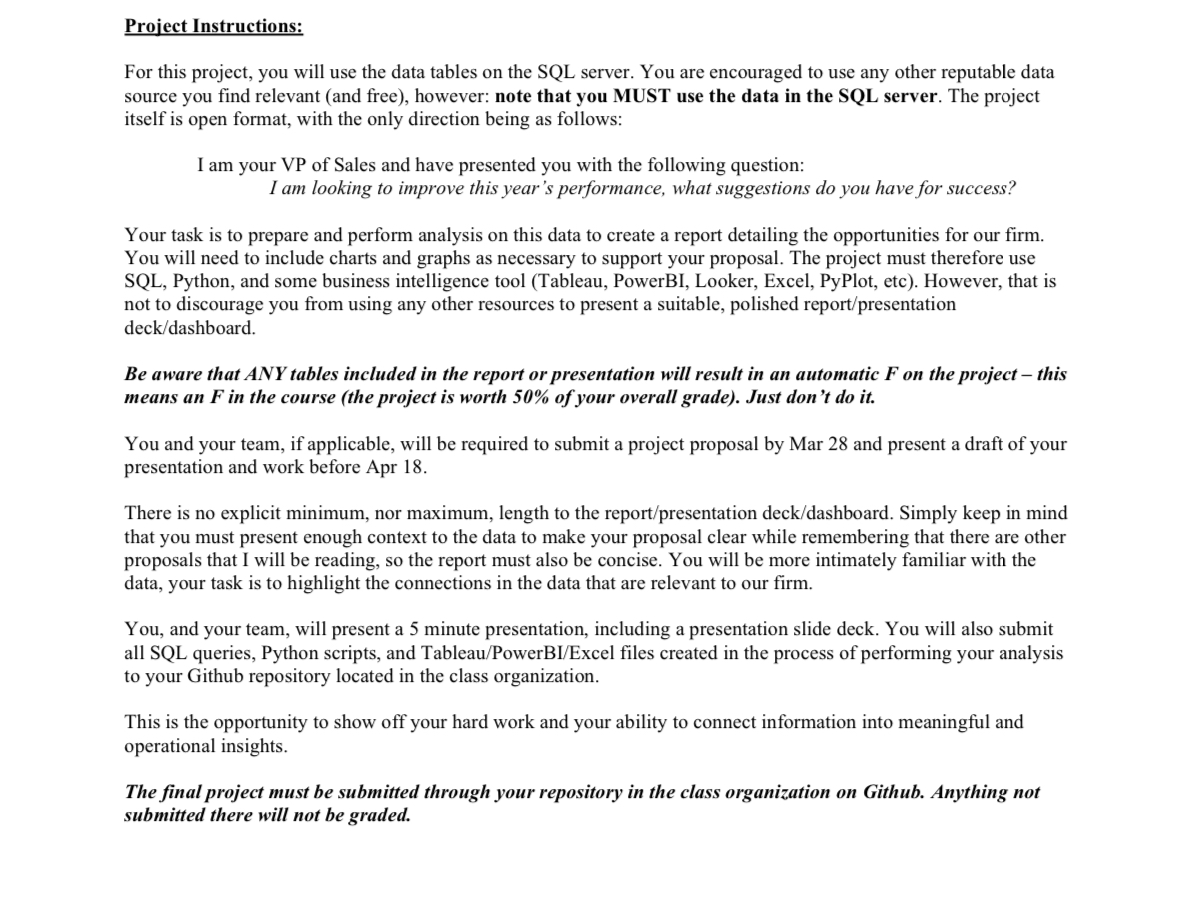
Project Instructions: For this project, you will use the data tables on the SQL server. You are encouraged to use any other reputable data source
Project Instructions:
For this project, you will use the data tables on the SQL server. You are encouraged to use any other reputable data source you find relevant and free however: note that you MUST use the data in the SQL server. The project itself is open format, with the only direction being as follows:
I am your VP of Sales and have presented you with the following question:
I am looking to improve this year's performance, what suggestions do you have for success?
Your task is to prepare and perform analysis on this data to create a report detailing the opportunities for our firm. You will need to include charts and graphs as necessary to support your proposal. The project must therefore use SQL Python, and some business intelligence tool Tableau PowerBI, Looker, Excel, PyPlot, etc However, that is not to discourage you from using any other resources to present a suitable, polished reportpresentation deckdashboard
Be aware that ANY tables included in the report or presentation will result in an automatic on the project this means an in the course the project is worth of your overall grade Just don't do it
You and your team, if applicable, will be required to submit a project proposal by Mar and present a draft of your presentation and work before Apr
There is no explicit minimum, nor maximum, length to the reportpresentation deckdashboard Simply keep in mind that you must present enough context to the data to make your proposal clear while remembering that there are other proposals that I will be reading, so the report must also be concise. You will be more intimately familiar with the data, your task is to highlight the connections in the data that are relevant to our firm.
You, and your team, will present a minute presentation, including a presentation slide deck. You will also submit all SQL queries, Python scripts, and TableauPowerBIExcel files created in the process of performing your analysis to your Github repository located in the class organization.
This is the opportunity to show off your hard work and your ability to connect information into meaningful and operational insights.
The final project must be submitted through your repository in the class organization on Github. Anything not submitted there will not be graded.

Step by Step Solution
There are 3 Steps involved in it
Step: 1

Get Instant Access to Expert-Tailored Solutions
See step-by-step solutions with expert insights and AI powered tools for academic success
Step: 2

Step: 3

Ace Your Homework with AI
Get the answers you need in no time with our AI-driven, step-by-step assistance
Get Started


