

Question
Project Management - Example I| BUS 308 ICA #4 Submissions: Question 1: Create the AON network diagram for the project to show the earliest and
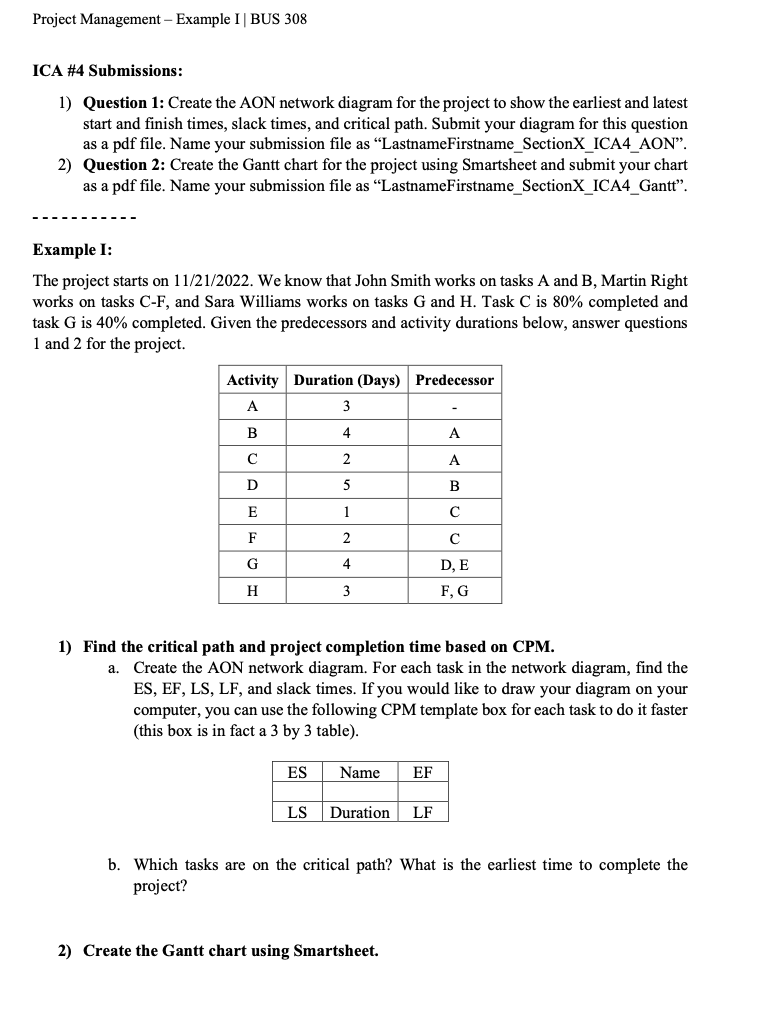 Project Management - Example I| BUS 308 ICA #4 Submissions: Question 1: Create the AON network diagram for the project to show the earliest and latest start and finish times, slack times, and critical path. Submit your diagram for this question as a pdf file. Name your submission file as "LastnameFirstname_SectionX_ICA4_AON". Question 2: Create the Gantt chart for the project using Smartsheet and submit your chart as a pdf file. Name your submission file as "LastnameFirstname_SectionX_ICA4_Gantt". Example I: The project starts on 11/21/2022. We know that John Smith works on tasks A and B, Martin Right works on tasks C-F, and Sara Williams works on tasks G and H. Task C is 80% completed and task G is 40% completed.
Step by Step Solution
There are 3 Steps involved in it
Step: 1

Get Instant Access to Expert-Tailored Solutions
See step-by-step solutions with expert insights and AI powered tools for academic success
Step: 2

Step: 3
Ace Your Homework with AI
Get the answers you need in no time with our AI-driven, step-by-step assistance
Get Started
Quantitative Methods For Business
Authors: David Anderson, Dennis Sweeney, Thomas Williams, Jeffrey Cam
11th Edition
978-0324651812, 324651813, 978-0324651751