Answered step by step
Verified Expert Solution
Question
1 Approved Answer
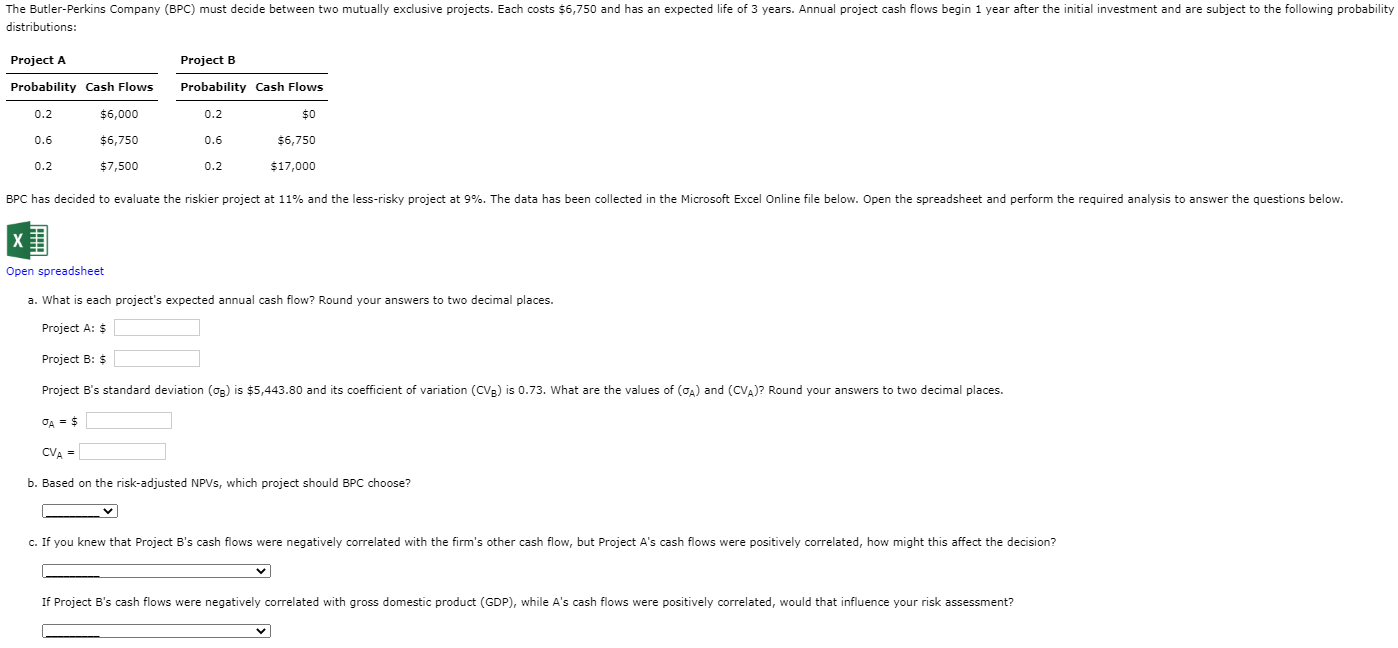
Project risk analysis Costs, Projects A and B $6,750.00 Expected life of projects (in years) 3 Difference between Project A CFs $750.00 Project A: Probability

| Project risk analysis | |||
| Costs, Projects A and B | $6,750.00 | ||
| Expected life of projects (in years) | 3 | ||
| Difference between Project A CFs | $750.00 | ||
| Project A: | |||
| Probability | Cash Flows | ||
| 0.2 | $6,000.00 | ||
| 0.6 | $6,750.00 | ||
| 0.2 | $7,500.00 | ||
| Project B: | |||
| Probability | Cash Flows | ||
| 0.2 | $0.00 | ||
| 0.6 | $6,750.00 | ||
| 0.2 | $17,000.00 | ||
| Discount rate, risky project | 11.00% | ||
| Discount rate, less risky project | 9.00% | ||
| Calculation of Expected CF, SD and CV: | Formulas | ||
| Project A: | |||
| Expected annual cash flow | #N/A | ||
| Standard deviation (SDA) | #N/A | ||
| Coefficient of variation (CVA) | #N/A | ||
| Project B: | |||
| Expected annual cash flow | #N/A | ||
| Standard deviation (SDB) | $9,227.00 | ||
| Coefficient of variation (CVB) | #DIV/0! | ||
| Which project is riskier? | #N/A | ||
| Project A risk-adjusted discount rate | #N/A | ||
| Project B risk-adjusted discount rate | #N/A | ||
| Calculation of Risk-Adjusted NPVs: | |||
| NPVA | #N/A | ||
| NPVB | #N/A | ||
| Which project should be chosen? | #N/A | ||
Step by Step Solution
There are 3 Steps involved in it
Step: 1

Get Instant Access to Expert-Tailored Solutions
See step-by-step solutions with expert insights and AI powered tools for academic success
Step: 2

Step: 3

Ace Your Homework with AI
Get the answers you need in no time with our AI-driven, step-by-step assistance
Get Started


