Project two years of financial statements.
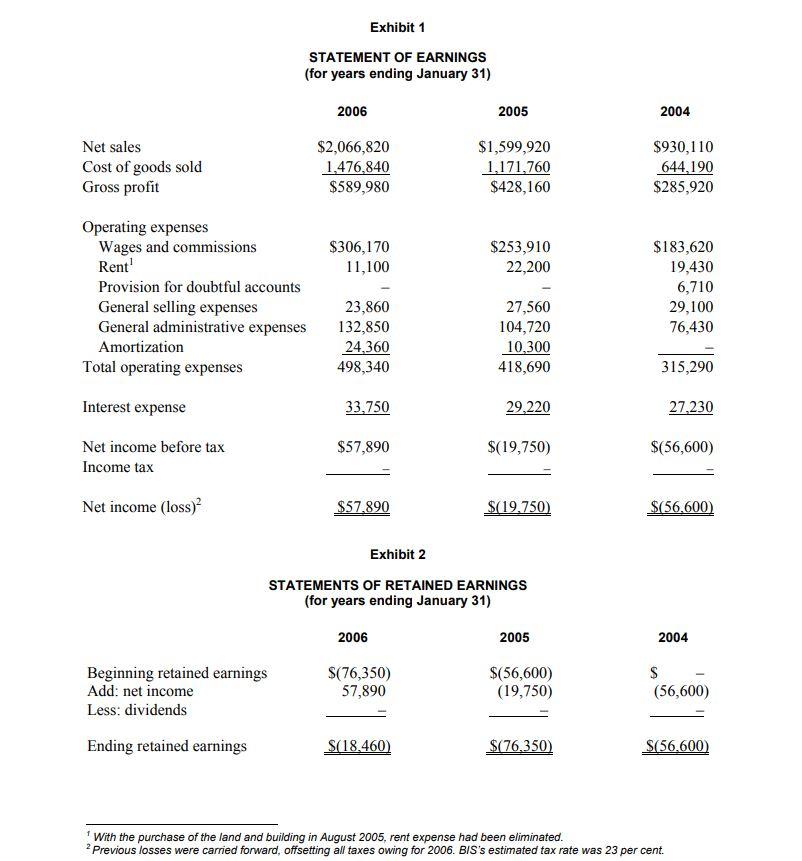
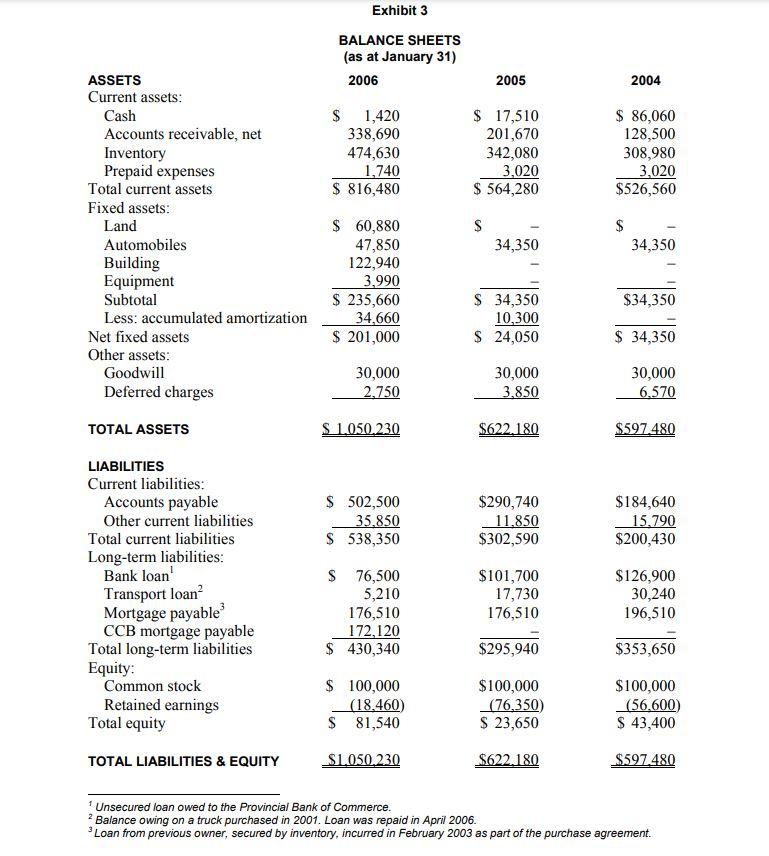
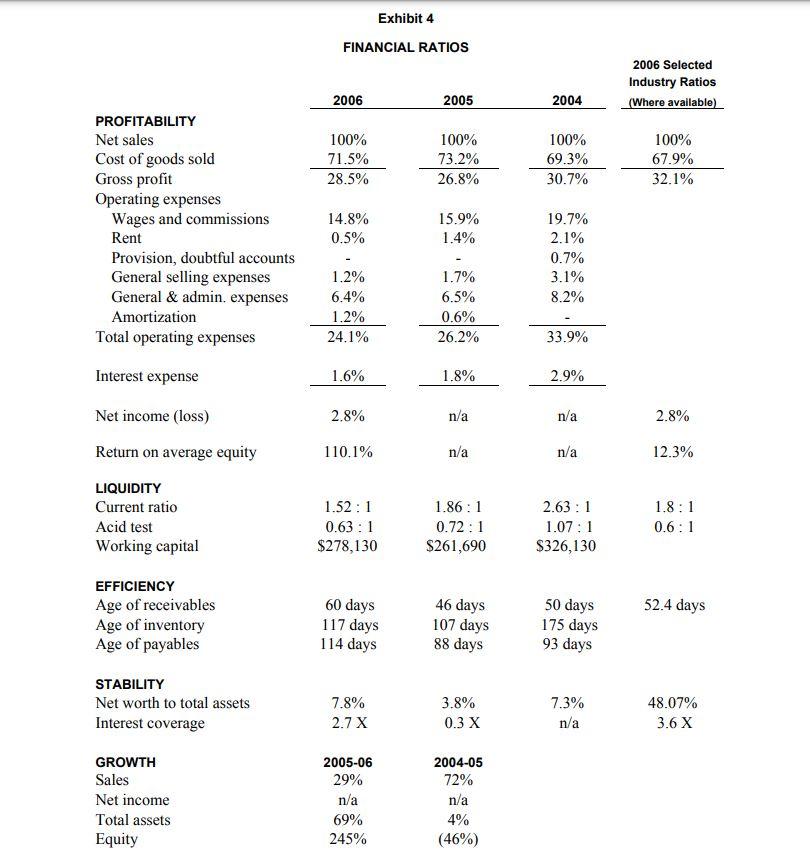
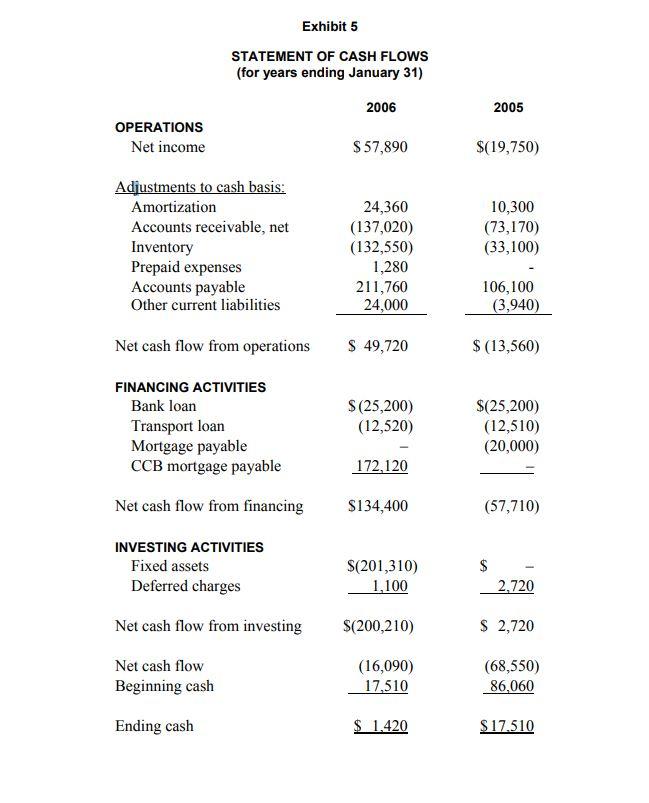
Exhibit 1 STATEMENT OF EARNINGS (for years ending January 31) 2006 2005 2004 Net sales Cost of goods sold Gross profit $2,066,820 1,476,840 $589,980 $1,599,920 1,171,760 $428,160 $930,110 644,190 $285,920 $306,170 11,100 $253,910 22,200 Operating expenses Wages and commissions Rent' Provision for doubtful accounts General selling expenses General administrative expenses Amortization Total operating expenses $183,620 19,430 6,710 29,100 76,430 23,860 132,850 24,360 498,340 27,560 104,720 10,300 418,690 315,290 Interest expense 33.750 29.220 27.230 $57,890 Net income before tax Income tax $(19,750) $(56,600) Net income (loss) $57,890 $(19,750) $(56.600) Exhibit 2 STATEMENTS OF RETAINED EARNINGS (for years ending January 31) 2006 2005 2004 Beginning retained earnings Add: net income Less: dividends $(76,350) 57,890 $(56,600) (19,750) $ (56,600) Ending retained earnings $(18,460) $(76,350) S(56.600) With the purchase of the land and building in August 2005, rent expense had been eliminated. ? Previous losses were carried forward, offsetting all taxes owing for 2006. BIS's estimated tax rate was 23 per cent. Exhibit 3 BALANCE SHEETS (as at January 31) 2006 2005 2004 $ 1,420 338,690 474,630 1,740 $ 816,480 $ 17,510 201,670 342,080 3,020 $ 564,280 $ 86,060 128,500 308,980 3,020 $526,560 S $ ASSETS Current assets: Cash Accounts receivable, net Inventory Prepaid expenses Total current assets Fixed assets: Land Automobiles Building Equipment Subtotal Less: accumulated amortization Net fixed assets Other assets: Goodwill Deferred charges 34,350 34,350 $ 60,880 47,850 122,940 3,990 $ 235,660 34,660 $ 201,000 $34,350 $ 34,350 10,300 $ 24,050 $ 34,350 30,000 2,750 30,000 3.850 30,000 6.570 TOTAL ASSETS S 1.050.230 $622,180 $597.480 $ 502,500 35.850 $ 538,350 $290,740 11,850 $302,590 $184,640 15.790 $200,430 LIABILITIES Current liabilities: Accounts payable Other current liabilities Total current liabilities Long-term liabilities: Bank loan Transport loan Mortgage payable CCB mortgage payable Total long-term liabilities Equity: Common stock Retained earnings Total equity $ 76,500 5,210 176,510 172,120 $ 430,340 $101,700 17,730 176,510 $126,900 30,240 196,510 $295,940 $353,650 $ 100,000 (18.460) $ 81,540 $100,000 (76,350) $ 23,650 $100,000 (56.600) $ 43,400 TOTAL LIABILITIES & EQUITY $1.050.230 $622,180 $597.480 Unsecured loan owed to the Provincial Bank of Commerce. Balance owing on a truck purchased in 2001. Loan was repaid in April 2006. * Loan from previous owner, secured by inventory, incurred in February 2003 as part of the purchase agreement. Exhibit 4 FINANCIAL RATIOS 2006 Selected Industry Ratios (Where available) 2006 2005 2004 100% 71.5% 28.5% 100% 73.2% 26.8% 100% 69.3% 30.7% 100% 67.9% 32.1% PROFITABILITY Net sales Cost of goods sold Gross profit Operating expenses Wages and commissions Rent Provision, doubtful accounts General selling expenses General & admin. expenses Amortization Total operating expenses 14.8% 0.5% 15.9% 1.4% 19.7% 2.1% 0.7% 3.1% 8.2% 1.2% 6.4% 1.2% 24.1% 1.7% 6.5% 0.6% 26.2% 33.9% Interest expense 1.6% 1.8% 2.9% Net income (loss) 2.8% n/a n/a 2.8% Return on average equity 110.1% n/a n/a 12.3% LIQUIDITY Current ratio Acid test Working capital 1.52:1 0.63 : 1 $278,130 1.86:1 0.72 : 1 $261,690 2.63:1 1.07:1 $326,130 1.8:1 0.6:1 52.4 days EFFICIENCY Age of receivables Age of inventory Age of payables 60 days 117 days 114 days 46 days 107 days 88 days 50 days 175 days 93 days STABILITY Net worth to total assets Interest coverage 7.8% 2.7 x 3.8% 0.3 X 7.3% n/a 48.07% 3.6 X GROWTH Sales Net income Total assets Equity 2005-06 29% n/a 69% 245% 2004-05 72% n/a 4% (46%) Exhibit 5 STATEMENT OF CASH FLOWS (for years ending January 31) 2006 2005 OPERATIONS Net income $ 57,890 $(19,750) Adjustments to cash basis: Amortization Accounts receivable, net Inventory Prepaid expenses Accounts payable Other current liabilities 24,360 (137,020) (132,550) 1,280 211,760 24,000 10,300 (73,170) (33,100) 106,100 (3,940) Net cash flow from operations $ 49,720 $(13,560) FINANCING ACTIVITIES Bank loan Transport loan Mortgage payable CCB mortgage payable $(25,200) (12,520) $(25,200) (12,510) (20,000) 172,120 Net cash flow from financing $134,400 (57,710) INVESTING ACTIVITIES Fixed assets Deferred charges $(201,310) 1,100 $ 2.720 Net cash flow from investing $(200,210) $ 2,720 Net cash flow Beginning cash (16,090) 17,510 (68,550) 86,060 Ending cash $ 1.420 $17.510 Exhibit 1 STATEMENT OF EARNINGS (for years ending January 31) 2006 2005 2004 Net sales Cost of goods sold Gross profit $2,066,820 1,476,840 $589,980 $1,599,920 1,171,760 $428,160 $930,110 644,190 $285,920 $306,170 11,100 $253,910 22,200 Operating expenses Wages and commissions Rent' Provision for doubtful accounts General selling expenses General administrative expenses Amortization Total operating expenses $183,620 19,430 6,710 29,100 76,430 23,860 132,850 24,360 498,340 27,560 104,720 10,300 418,690 315,290 Interest expense 33.750 29.220 27.230 $57,890 Net income before tax Income tax $(19,750) $(56,600) Net income (loss) $57,890 $(19,750) $(56.600) Exhibit 2 STATEMENTS OF RETAINED EARNINGS (for years ending January 31) 2006 2005 2004 Beginning retained earnings Add: net income Less: dividends $(76,350) 57,890 $(56,600) (19,750) $ (56,600) Ending retained earnings $(18,460) $(76,350) S(56.600) With the purchase of the land and building in August 2005, rent expense had been eliminated. ? Previous losses were carried forward, offsetting all taxes owing for 2006. BIS's estimated tax rate was 23 per cent. Exhibit 3 BALANCE SHEETS (as at January 31) 2006 2005 2004 $ 1,420 338,690 474,630 1,740 $ 816,480 $ 17,510 201,670 342,080 3,020 $ 564,280 $ 86,060 128,500 308,980 3,020 $526,560 S $ ASSETS Current assets: Cash Accounts receivable, net Inventory Prepaid expenses Total current assets Fixed assets: Land Automobiles Building Equipment Subtotal Less: accumulated amortization Net fixed assets Other assets: Goodwill Deferred charges 34,350 34,350 $ 60,880 47,850 122,940 3,990 $ 235,660 34,660 $ 201,000 $34,350 $ 34,350 10,300 $ 24,050 $ 34,350 30,000 2,750 30,000 3.850 30,000 6.570 TOTAL ASSETS S 1.050.230 $622,180 $597.480 $ 502,500 35.850 $ 538,350 $290,740 11,850 $302,590 $184,640 15.790 $200,430 LIABILITIES Current liabilities: Accounts payable Other current liabilities Total current liabilities Long-term liabilities: Bank loan Transport loan Mortgage payable CCB mortgage payable Total long-term liabilities Equity: Common stock Retained earnings Total equity $ 76,500 5,210 176,510 172,120 $ 430,340 $101,700 17,730 176,510 $126,900 30,240 196,510 $295,940 $353,650 $ 100,000 (18.460) $ 81,540 $100,000 (76,350) $ 23,650 $100,000 (56.600) $ 43,400 TOTAL LIABILITIES & EQUITY $1.050.230 $622,180 $597.480 Unsecured loan owed to the Provincial Bank of Commerce. Balance owing on a truck purchased in 2001. Loan was repaid in April 2006. * Loan from previous owner, secured by inventory, incurred in February 2003 as part of the purchase agreement. Exhibit 4 FINANCIAL RATIOS 2006 Selected Industry Ratios (Where available) 2006 2005 2004 100% 71.5% 28.5% 100% 73.2% 26.8% 100% 69.3% 30.7% 100% 67.9% 32.1% PROFITABILITY Net sales Cost of goods sold Gross profit Operating expenses Wages and commissions Rent Provision, doubtful accounts General selling expenses General & admin. expenses Amortization Total operating expenses 14.8% 0.5% 15.9% 1.4% 19.7% 2.1% 0.7% 3.1% 8.2% 1.2% 6.4% 1.2% 24.1% 1.7% 6.5% 0.6% 26.2% 33.9% Interest expense 1.6% 1.8% 2.9% Net income (loss) 2.8% n/a n/a 2.8% Return on average equity 110.1% n/a n/a 12.3% LIQUIDITY Current ratio Acid test Working capital 1.52:1 0.63 : 1 $278,130 1.86:1 0.72 : 1 $261,690 2.63:1 1.07:1 $326,130 1.8:1 0.6:1 52.4 days EFFICIENCY Age of receivables Age of inventory Age of payables 60 days 117 days 114 days 46 days 107 days 88 days 50 days 175 days 93 days STABILITY Net worth to total assets Interest coverage 7.8% 2.7 x 3.8% 0.3 X 7.3% n/a 48.07% 3.6 X GROWTH Sales Net income Total assets Equity 2005-06 29% n/a 69% 245% 2004-05 72% n/a 4% (46%) Exhibit 5 STATEMENT OF CASH FLOWS (for years ending January 31) 2006 2005 OPERATIONS Net income $ 57,890 $(19,750) Adjustments to cash basis: Amortization Accounts receivable, net Inventory Prepaid expenses Accounts payable Other current liabilities 24,360 (137,020) (132,550) 1,280 211,760 24,000 10,300 (73,170) (33,100) 106,100 (3,940) Net cash flow from operations $ 49,720 $(13,560) FINANCING ACTIVITIES Bank loan Transport loan Mortgage payable CCB mortgage payable $(25,200) (12,520) $(25,200) (12,510) (20,000) 172,120 Net cash flow from financing $134,400 (57,710) INVESTING ACTIVITIES Fixed assets Deferred charges $(201,310) 1,100 $ 2.720 Net cash flow from investing $(200,210) $ 2,720 Net cash flow Beginning cash (16,090) 17,510 (68,550) 86,060 Ending cash $ 1.420 $17.510