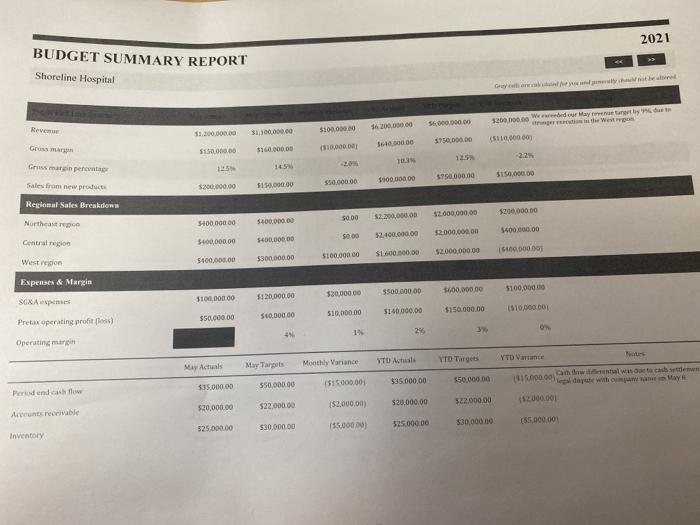
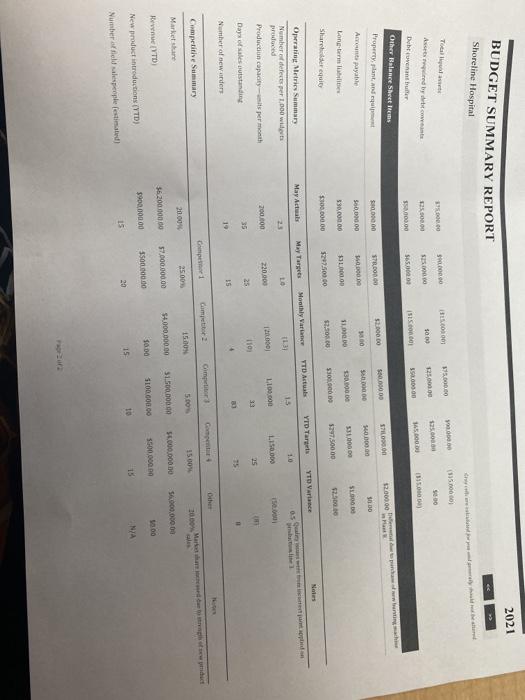
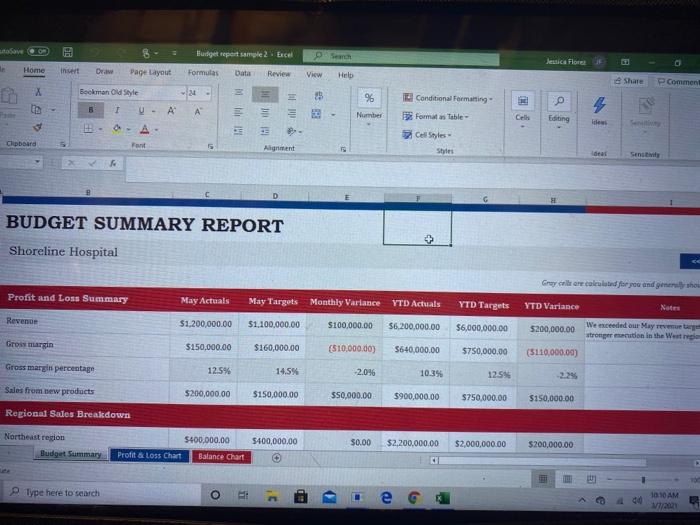
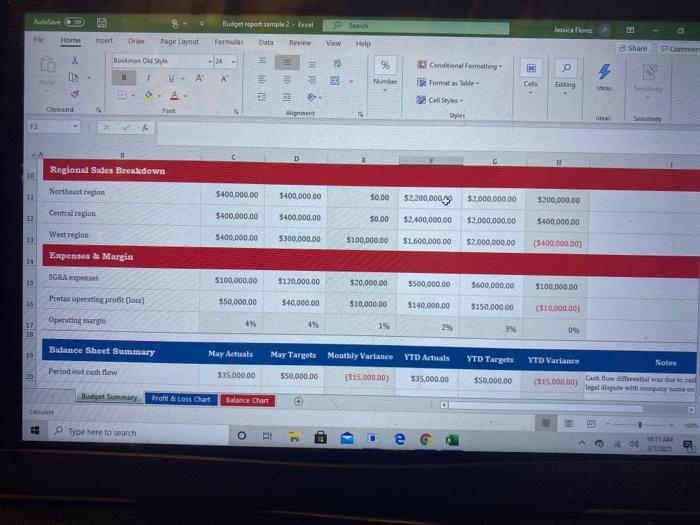
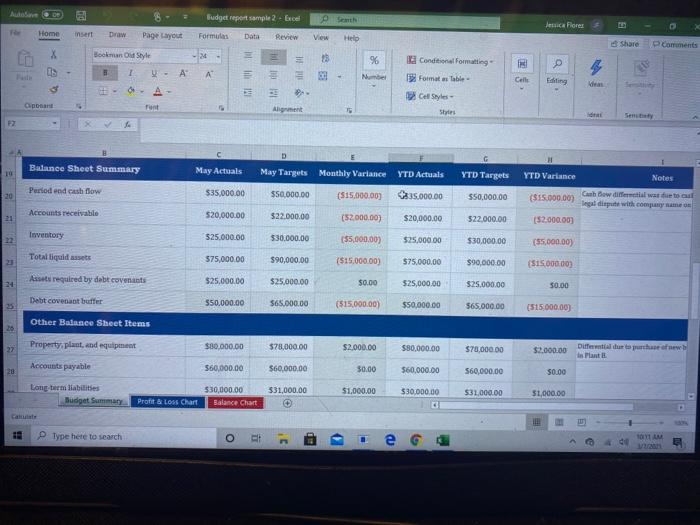
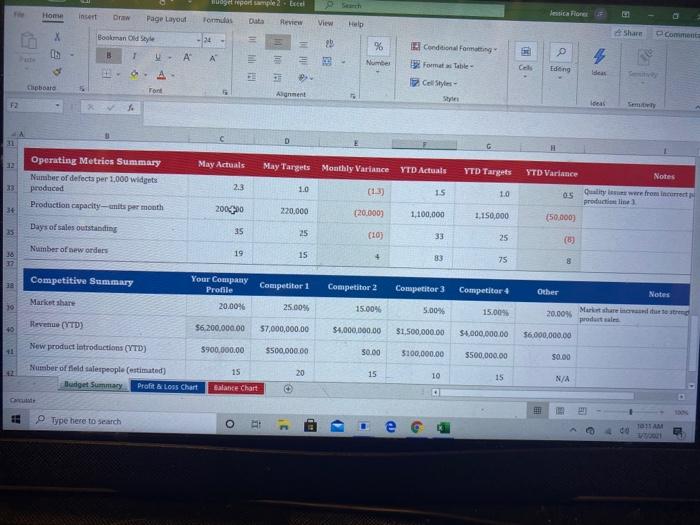
Prompt For this assignment, review the balance sheet for Shoreline Hospital Next, write a 500-word financial viability analysis of what areas require improvements, what areas are performing well, and what advice you have for the organization Include at least 2 citations for use as references. Your file submission should be named Lastname_Firstname_Assignment_3 2021 BUDGET SUMMARY REPORT Shoreline Hospital S600,000.00 Revenue $200.000.00 $100.000,00 31,100,000.00 3200.000.00 Wed May tunert by in the West (511000000 11.200.000.00 575000 10000 515000.00 $160.000 (110.000.00 Gruss mario per 125 $10000 $750.000.00 $150,000.00 Sales from new product $200,000.00 $150,000.00 550,000.00 Regional Sales Breakdown $200.000.00 5000 $2.000.000,00 12.200.000.00 Northeast $100.000.00 S400.000.00 $2.000.000.00 5400.000.00 52.400.000.00 50.00 Central region $400,000.00 SODOBOD 100.000 $2,000,000.00 $100,000.00 $1.600.000,00 $300,000.00 5400,000.00 Westion Expenses & Margin SC&A expenses Pretax operating profit) 5500,000.00 600.000.00 $100,000.00 $100,000.00 130.000.00 $120,000.00 $140.000.00 $150.000.00 510.000.00 (510.000.000 S00000 $50,000.00 2% Operating margin YTDA YTD Varande May Actuals May Targets Monthly Variance YTD Target $35.000.00 $35.000.00 51.000.000 $50.000,00 550.000.00 Pendenci $20,000.00 522.000.00 $20,000.00 152.000.00 152.000.00 $22.000.00 Antrovable 525.000.00 530.000.00 (55.000.000 525.000.00 $30,000.00 155.000,00) Inventory 2021 BUDGET SUMMARY REPORT Shoreline Hospital DO (185.000 395.000 S60 500 125.000.00 .. 100 S. SAS.DOC 352.000.00 100.00 ISIS. S65.000 Dubenabler Othew Balance Sheet Bens SLO 12.000 de les pochwertiga 500.000 000000 2. DO STRONO Property, plant and Apayable 3000 3800 S000.00 MODO $6000000 500,000.00 SI 006 3. 5310000 1.000 330,000.00 51.000.00 Lone bem Share requiry 5297.500.00 $250 10.000.00 $2.00 $300.000.00 5297.500.00 YTD Target YTD) Actuals YTD Vrance May Actuals Monthly var May Tags 1.0 15 05 to Operating Metrics Summary Number of defects per 1.000 Wirts Produced Production capacity is per month 120.000 L150.000 1.100.000 220.000 700.000 33 25 110 25 35 Days of sales outstanding 19 15 Number of sewarders Other Cimpre Game Camper Competitive Summary Marte harte 5.00 15.00 25.00% 20.00% Market share 56.000.000.00 51.500.000 56.000.000.00 $4,000,000.00 57.000.000.00 56.200.000.00 Hewne YTD SLO 000.00 5500,000.00 $900,000.00 350.000.00 New product introductions (YTD) 10 NA 15 20 15 Number atteldalespeople estimated) Prompt For this assignment, review the balance sheet for Shoreline Hospital. Next, write a 500-wore financial viability analysis of what areas require improvements, what areas are performing well, and what advice you have for the organization. Include at least 2 citations for use as references. Your file submission should be named Lastname_Firstname_Assignment_3 Soverom Budget report sale 2. Excel Formulas bata Review Jessica Flor Home Insert Draw Page Layout View Help Share Comment Bookman Style 25 96 Conditional Formatting Nole 4 B 1 - A A Number Formatos table- Cell Editing Ide Clipboard Font Cell Styles Shites Alignment das Sentivi BUDGET SUMMARY REPORT Shoreline Hospital Gray care calculated for you and generally show Profit and Loss Summary May Actuals May Targets Monthly Variance YTD Actuals YTD Targets YTD Variance Notes Revenue $1,200,000.00 $1,100,000.00 $100,000.00 56,200,000.00 $6,000,000.00 5200,000.00 We needed our May strongerention in the West Gros margin $150,000.00 $160,000.00 ($10,000.00) S640,000.00 $750,000.00 ($110,000.00) Gross margin percentage 12.5% 14.5% 2.0% 10.3% 12.5% 2.24 Sales from new products $200,000.00 $150,000.00 550,000.00 $900,000.00 $750,000.00 $150,000.00 Regional Sales Breakdown Northeast region Budget Summary $400,000.00 $400,000.00 Profit & Loss Chart Balance Chart 50.00 $2,200,000.00 $2,000,000.00 $200,000.00 D Type here to search o 10:10 AM 2 Budget report sample 2 Excel Search Jessica Flores Hile Home Draw Page Layout Formulas Data view View Share commen Bookman Style PB % Conditional Formatting - 8 1 - A A lili IN Number Formate Cels Font Alimt Styles F D Regional Sales Breakdown Northeast region $400,000.00 $400,000.00 $0.00 $2,200,000 $2,000,000.00 $200,000.00 Central region 12 $400,000.00 5400,000.00 50.00 $2.400,000.00 $2,000,000.00 $400,000.00 West region 13 $400,000.00 $300.000,00 $100,000.00 $1,600,000.00 $2,000,000.00 (5-100,000.00) Expenses & Margin 14 SG speed 15 $100,000.00 $120.000.00 $20,000.00 $500,000.00 5600,000.00 $100,000.00 Pretax operating profit Clou) 10 $50,000.00 540,000.00 $10,000.00 $140,000.00 $150,000.00 (510.000,00) Operating margt ** 17 18 29% 3% 09 Balance Sheet Summary 19 May Actuals May Targets Monthly Variance YTD Actuals YTD Targets YTD Variance Notes Periododexth flow 20 $35.000.00 $50,000.00 (515.000.00) 535,000.00 $50,000.00 Gabow diffuta wa (515.000.00) Dudget Summary Proft & Loss Chart Balance Chart Type here to search o - e G C TAM oh 5 a Budget report sample 2 - Excel Seth deca Fiores Home insert Draw Page Layout Formulas Data Review View Help Share Comments Bookman Style 23 96 5 1 - A A Nobel Cell 12 Conditional Formatting Formats Table Cel Styles - Styles ing Opears 25 Anment Tunt P2 Balance Sheet Summary May Actuals May Targets Monthly Variance YTD Actuals YTD Targets YTD Variance Notes Period end cash flow 20 $35,000.00 $50,000.00 (515.000.00) 15.000.00 $50,000.00 ($15.000.00) Ganh Bow diffential was to legal dispute with company names Accounts receivable 21 $20,000.00 322.000.00 (52.000.00) $20,000.00 522,000.00 ($2.000,00) Inventory 525.000.00 530,000.00 ($5,000.00 $25,000.00 $30,000.00 ($5.000.00) Totalliquids 575,000.00 $90,000.00 ($15.000.00) 575.000.00 $90,000.00 (S15.000.00) Asset required by debt covenants 21 $25,000.00 $25,000.00 50.00 $25,000.00 $25,000.00 50.00 Debt covenant buffer 550,000.00 $65.000.00 (515.000,00) $50,000.00 565,000.00 (515.000,00) Other Balance Sheet Items Property, plant, and equipment 27 $30,000.00 $78,000.00 $2.000.00 $80,000.00 $70,000.00 $2.000,00 Different that purchase few In Plant Accounts payable 20 560,000.00 $60,000.00 $0.00 $60,000.00 560,000.00 50.00 Long term liabilities Budget Summary 331,000.00 $1,000.00 530,000.00 $30,000.00 Balance Chart $31.000.00 51.000.00 Profit & Loss Chart Type here to search O e de 10 Home ad per sample 2. Escal Tomos Data view Jessica Flores View Help Draw Page Layout Bookman Old Style UA Comment 29 if I A % Number El Conditional Forming Format Table I Celt Edong Clipboard Tort Alignment F2 Ideas Sem 21 May Actuals May Targets Monthly Variance YTD Actuals YTD Targets Operating Metries Summary Number of defects per 1.000 widgets produced Production capacity--mits per month 2.3 1.0 (13) 1.5 1.0 YTD Variance Notes Os Quality as were from incorrect product line (50.000) 1+ 200410 220.000 [20.000) 1,100,000 1,150,000 Days of sales outstanding 35 25 (10) 33 25 (6) 38 Number of new orders 19 15 83 75 Competitive Summary Your Company Profile 20.00% Competitor 1 Competitor 2 Competitor 3 Competitor 4 Other Notes 10 Market share 25.00% 15.00% 5.00% 15.004 20.00% Marlshare the tested products Rev (YTD) 40 $6,200,000.00 57,000,000.00 $4,000,000.00 $1,500,000.00 $4,000,000.00 $6,000,000.00 New product latroductions (YTD) 11 5900,000.00 $500,000.00 50.00 $100,000.00 5500,000.00 50.00 Number of field salespeople estimated) Budget Summary Profit & Loss Chart 15 20 15 10 15 N/A Balance Chart Q Type here to search o - co 101 AM w DS Prompt For this assignment, review the balance sheet for Shoreline Hospital Next, write a 500-word financial viability analysis of what areas require improvements, what areas are performing well, and what advice you have for the organization Include at least 2 citations for use as references. Your file submission should be named Lastname_Firstname_Assignment_3 2021 BUDGET SUMMARY REPORT Shoreline Hospital S600,000.00 Revenue $200.000.00 $100.000,00 31,100,000.00 3200.000.00 Wed May tunert by in the West (511000000 11.200.000.00 575000 10000 515000.00 $160.000 (110.000.00 Gruss mario per 125 $10000 $750.000.00 $150,000.00 Sales from new product $200,000.00 $150,000.00 550,000.00 Regional Sales Breakdown $200.000.00 5000 $2.000.000,00 12.200.000.00 Northeast $100.000.00 S400.000.00 $2.000.000.00 5400.000.00 52.400.000.00 50.00 Central region $400,000.00 SODOBOD 100.000 $2,000,000.00 $100,000.00 $1.600.000,00 $300,000.00 5400,000.00 Westion Expenses & Margin SC&A expenses Pretax operating profit) 5500,000.00 600.000.00 $100,000.00 $100,000.00 130.000.00 $120,000.00 $140.000.00 $150.000.00 510.000.00 (510.000.000 S00000 $50,000.00 2% Operating margin YTDA YTD Varande May Actuals May Targets Monthly Variance YTD Target $35.000.00 $35.000.00 51.000.000 $50.000,00 550.000.00 Pendenci $20,000.00 522.000.00 $20,000.00 152.000.00 152.000.00 $22.000.00 Antrovable 525.000.00 530.000.00 (55.000.000 525.000.00 $30,000.00 155.000,00) Inventory 2021 BUDGET SUMMARY REPORT Shoreline Hospital DO (185.000 395.000 S60 500 125.000.00 .. 100 S. SAS.DOC 352.000.00 100.00 ISIS. S65.000 Dubenabler Othew Balance Sheet Bens SLO 12.000 de les pochwertiga 500.000 000000 2. DO STRONO Property, plant and Apayable 3000 3800 S000.00 MODO $6000000 500,000.00 SI 006 3. 5310000 1.000 330,000.00 51.000.00 Lone bem Share requiry 5297.500.00 $250 10.000.00 $2.00 $300.000.00 5297.500.00 YTD Target YTD) Actuals YTD Vrance May Actuals Monthly var May Tags 1.0 15 05 to Operating Metrics Summary Number of defects per 1.000 Wirts Produced Production capacity is per month 120.000 L150.000 1.100.000 220.000 700.000 33 25 110 25 35 Days of sales outstanding 19 15 Number of sewarders Other Cimpre Game Camper Competitive Summary Marte harte 5.00 15.00 25.00% 20.00% Market share 56.000.000.00 51.500.000 56.000.000.00 $4,000,000.00 57.000.000.00 56.200.000.00 Hewne YTD SLO 000.00 5500,000.00 $900,000.00 350.000.00 New product introductions (YTD) 10 NA 15 20 15 Number atteldalespeople estimated) Prompt For this assignment, review the balance sheet for Shoreline Hospital. Next, write a 500-wore financial viability analysis of what areas require improvements, what areas are performing well, and what advice you have for the organization. Include at least 2 citations for use as references. Your file submission should be named Lastname_Firstname_Assignment_3 Soverom Budget report sale 2. Excel Formulas bata Review Jessica Flor Home Insert Draw Page Layout View Help Share Comment Bookman Style 25 96 Conditional Formatting Nole 4 B 1 - A A Number Formatos table- Cell Editing Ide Clipboard Font Cell Styles Shites Alignment das Sentivi BUDGET SUMMARY REPORT Shoreline Hospital Gray care calculated for you and generally show Profit and Loss Summary May Actuals May Targets Monthly Variance YTD Actuals YTD Targets YTD Variance Notes Revenue $1,200,000.00 $1,100,000.00 $100,000.00 56,200,000.00 $6,000,000.00 5200,000.00 We needed our May strongerention in the West Gros margin $150,000.00 $160,000.00 ($10,000.00) S640,000.00 $750,000.00 ($110,000.00) Gross margin percentage 12.5% 14.5% 2.0% 10.3% 12.5% 2.24 Sales from new products $200,000.00 $150,000.00 550,000.00 $900,000.00 $750,000.00 $150,000.00 Regional Sales Breakdown Northeast region Budget Summary $400,000.00 $400,000.00 Profit & Loss Chart Balance Chart 50.00 $2,200,000.00 $2,000,000.00 $200,000.00 D Type here to search o 10:10 AM 2 Budget report sample 2 Excel Search Jessica Flores Hile Home Draw Page Layout Formulas Data view View Share commen Bookman Style PB % Conditional Formatting - 8 1 - A A lili IN Number Formate Cels Font Alimt Styles F D Regional Sales Breakdown Northeast region $400,000.00 $400,000.00 $0.00 $2,200,000 $2,000,000.00 $200,000.00 Central region 12 $400,000.00 5400,000.00 50.00 $2.400,000.00 $2,000,000.00 $400,000.00 West region 13 $400,000.00 $300.000,00 $100,000.00 $1,600,000.00 $2,000,000.00 (5-100,000.00) Expenses & Margin 14 SG speed 15 $100,000.00 $120.000.00 $20,000.00 $500,000.00 5600,000.00 $100,000.00 Pretax operating profit Clou) 10 $50,000.00 540,000.00 $10,000.00 $140,000.00 $150,000.00 (510.000,00) Operating margt ** 17 18 29% 3% 09 Balance Sheet Summary 19 May Actuals May Targets Monthly Variance YTD Actuals YTD Targets YTD Variance Notes Periododexth flow 20 $35.000.00 $50,000.00 (515.000.00) 535,000.00 $50,000.00 Gabow diffuta wa (515.000.00) Dudget Summary Proft & Loss Chart Balance Chart Type here to search o - e G C TAM oh 5 a Budget report sample 2 - Excel Seth deca Fiores Home insert Draw Page Layout Formulas Data Review View Help Share Comments Bookman Style 23 96 5 1 - A A Nobel Cell 12 Conditional Formatting Formats Table Cel Styles - Styles ing Opears 25 Anment Tunt P2 Balance Sheet Summary May Actuals May Targets Monthly Variance YTD Actuals YTD Targets YTD Variance Notes Period end cash flow 20 $35,000.00 $50,000.00 (515.000.00) 15.000.00 $50,000.00 ($15.000.00) Ganh Bow diffential was to legal dispute with company names Accounts receivable 21 $20,000.00 322.000.00 (52.000.00) $20,000.00 522,000.00 ($2.000,00) Inventory 525.000.00 530,000.00 ($5,000.00 $25,000.00 $30,000.00 ($5.000.00) Totalliquids 575,000.00 $90,000.00 ($15.000.00) 575.000.00 $90,000.00 (S15.000.00) Asset required by debt covenants 21 $25,000.00 $25,000.00 50.00 $25,000.00 $25,000.00 50.00 Debt covenant buffer 550,000.00 $65.000.00 (515.000,00) $50,000.00 565,000.00 (515.000,00) Other Balance Sheet Items Property, plant, and equipment 27 $30,000.00 $78,000.00 $2.000.00 $80,000.00 $70,000.00 $2.000,00 Different that purchase few In Plant Accounts payable 20 560,000.00 $60,000.00 $0.00 $60,000.00 560,000.00 50.00 Long term liabilities Budget Summary 331,000.00 $1,000.00 530,000.00 $30,000.00 Balance Chart $31.000.00 51.000.00 Profit & Loss Chart Type here to search O e de 10 Home ad per sample 2. Escal Tomos Data view Jessica Flores View Help Draw Page Layout Bookman Old Style UA Comment 29 if I A % Number El Conditional Forming Format Table I Celt Edong Clipboard Tort Alignment F2 Ideas Sem 21 May Actuals May Targets Monthly Variance YTD Actuals YTD Targets Operating Metries Summary Number of defects per 1.000 widgets produced Production capacity--mits per month 2.3 1.0 (13) 1.5 1.0 YTD Variance Notes Os Quality as were from incorrect product line (50.000) 1+ 200410 220.000 [20.000) 1,100,000 1,150,000 Days of sales outstanding 35 25 (10) 33 25 (6) 38 Number of new orders 19 15 83 75 Competitive Summary Your Company Profile 20.00% Competitor 1 Competitor 2 Competitor 3 Competitor 4 Other Notes 10 Market share 25.00% 15.00% 5.00% 15.004 20.00% Marlshare the tested products Rev (YTD) 40 $6,200,000.00 57,000,000.00 $4,000,000.00 $1,500,000.00 $4,000,000.00 $6,000,000.00 New product latroductions (YTD) 11 5900,000.00 $500,000.00 50.00 $100,000.00 5500,000.00 50.00 Number of field salespeople estimated) Budget Summary Profit & Loss Chart 15 20 15 10 15 N/A Balance Chart Q Type here to search o - co 101 AM w DS
