Propose Temperature vs X Factor Experiment Instruction: Come up with an experiment idea and answer the following question: See the provided example (already answered question).
Propose Temperature vs X Factor Experiment
Instruction: Come up with an experiment idea and answer the following question: See the provided example (already answered question). Note - You are not going to conduct the experiments, this is just a proposal.
Example:
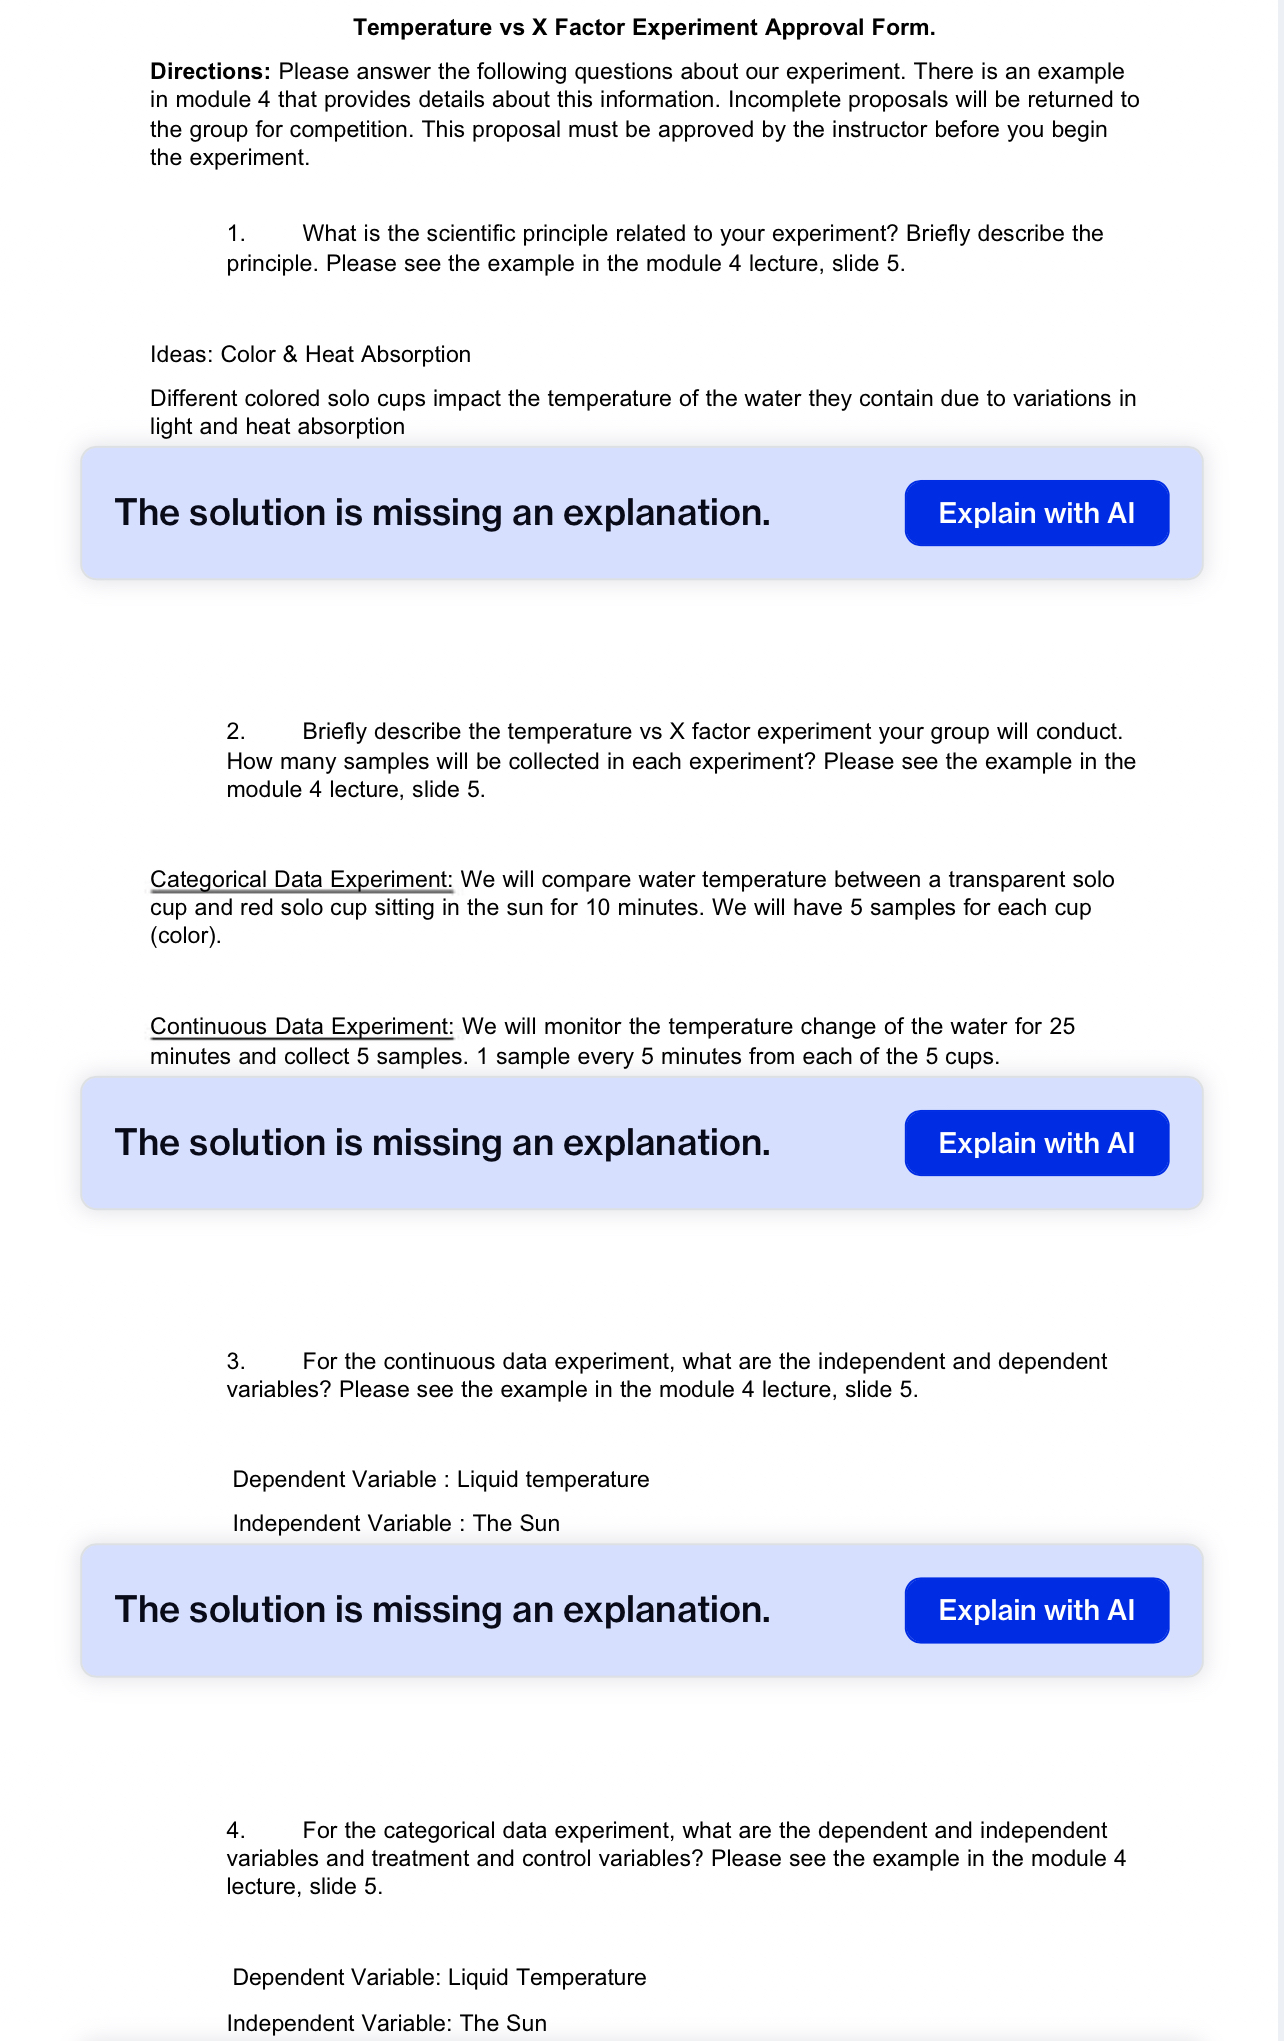
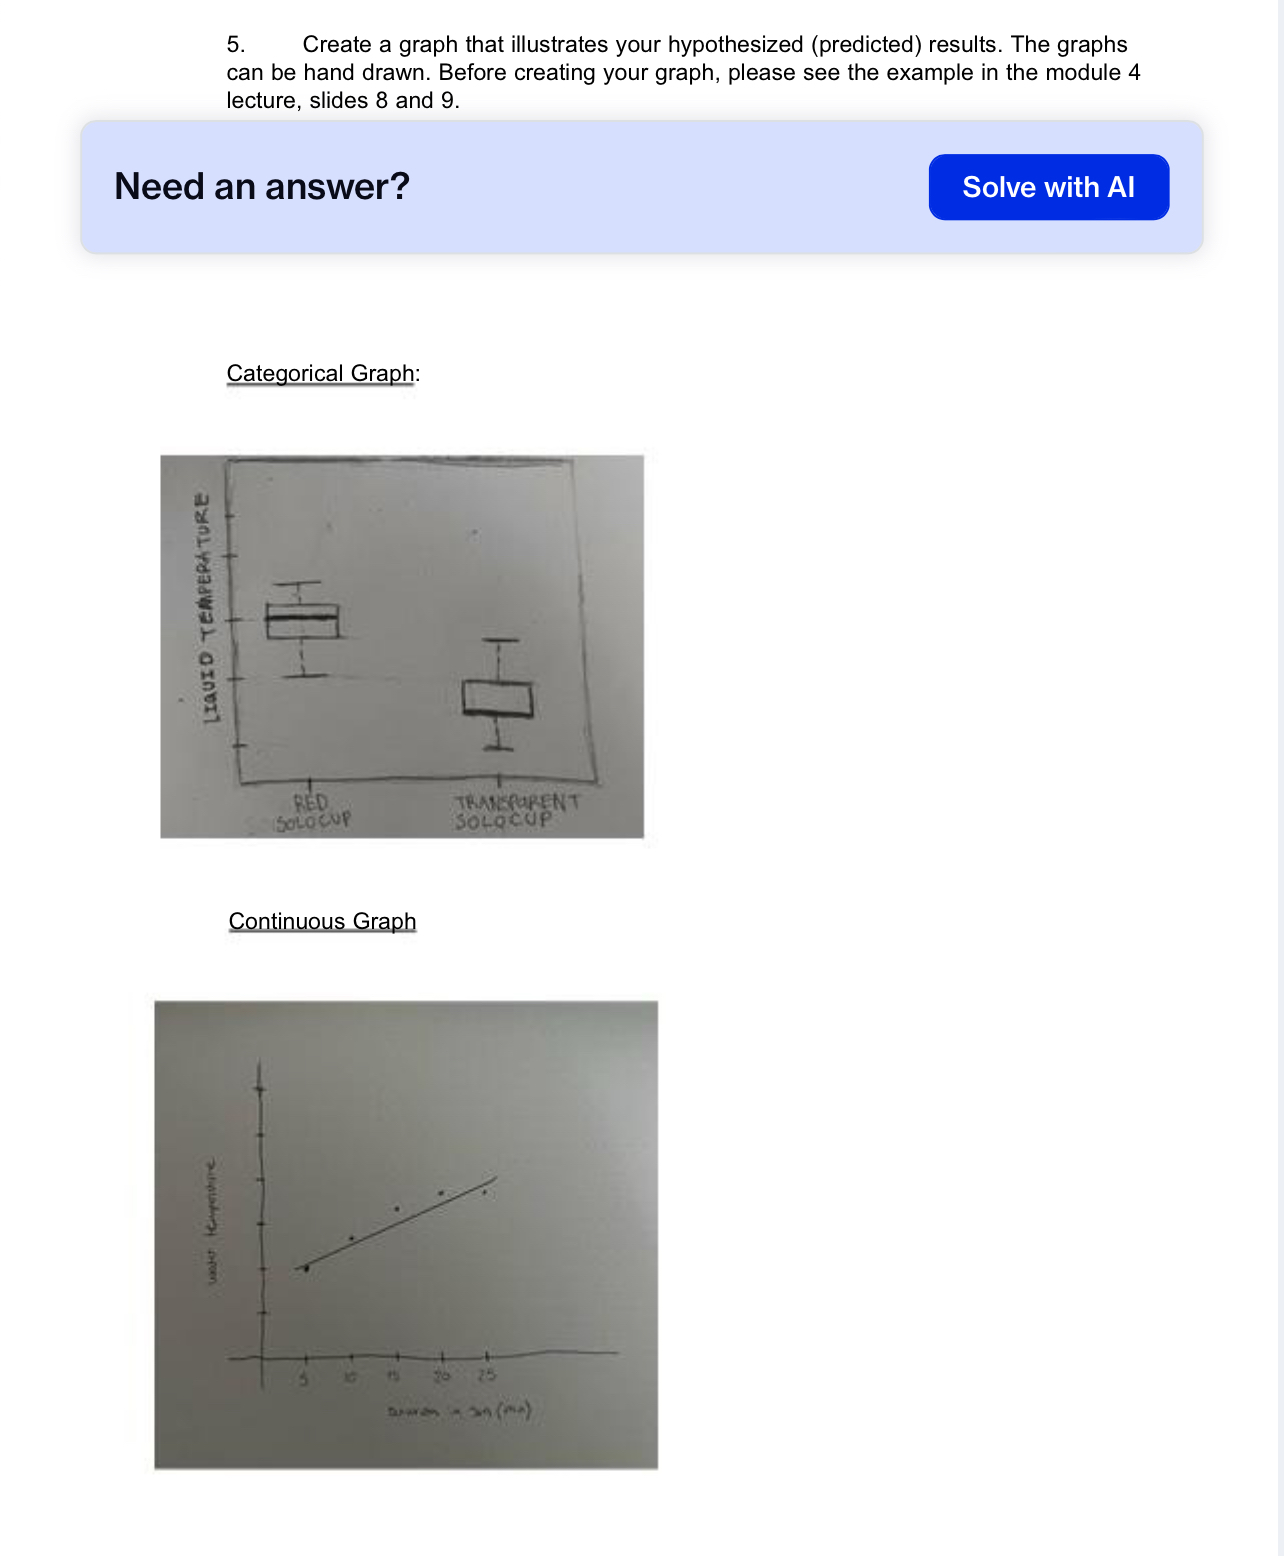
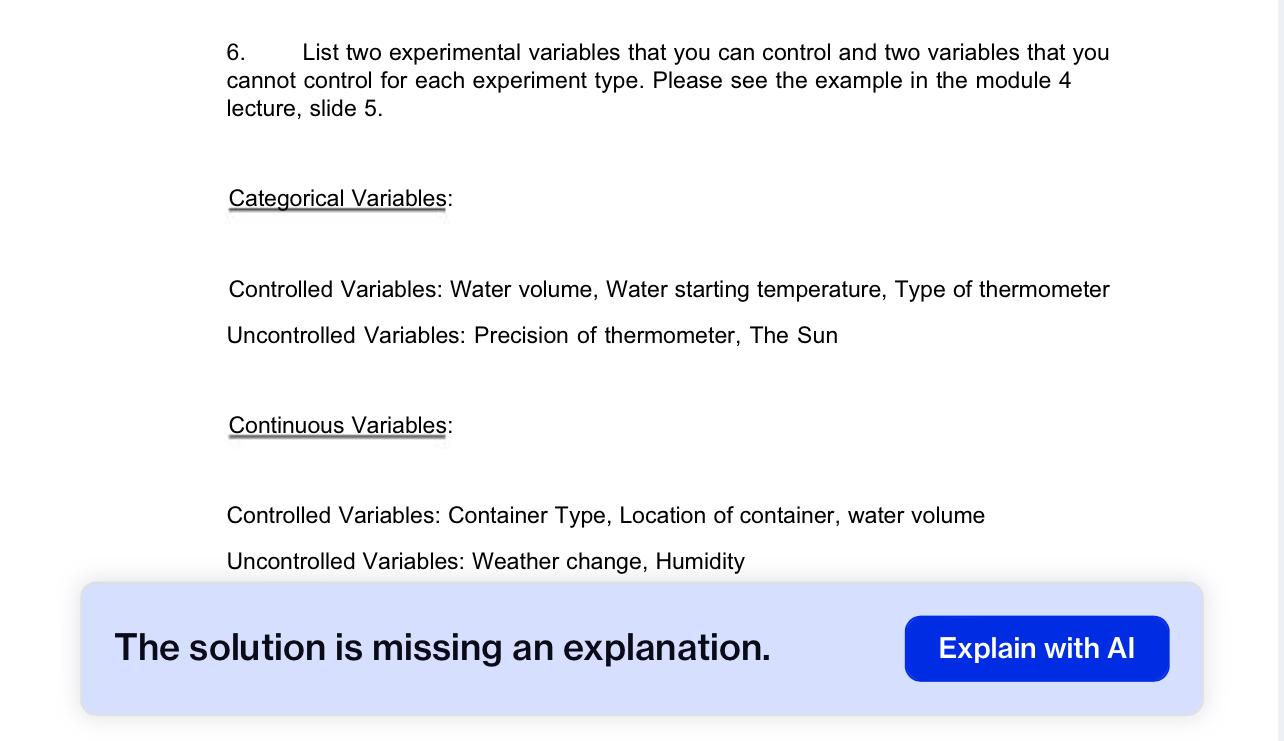
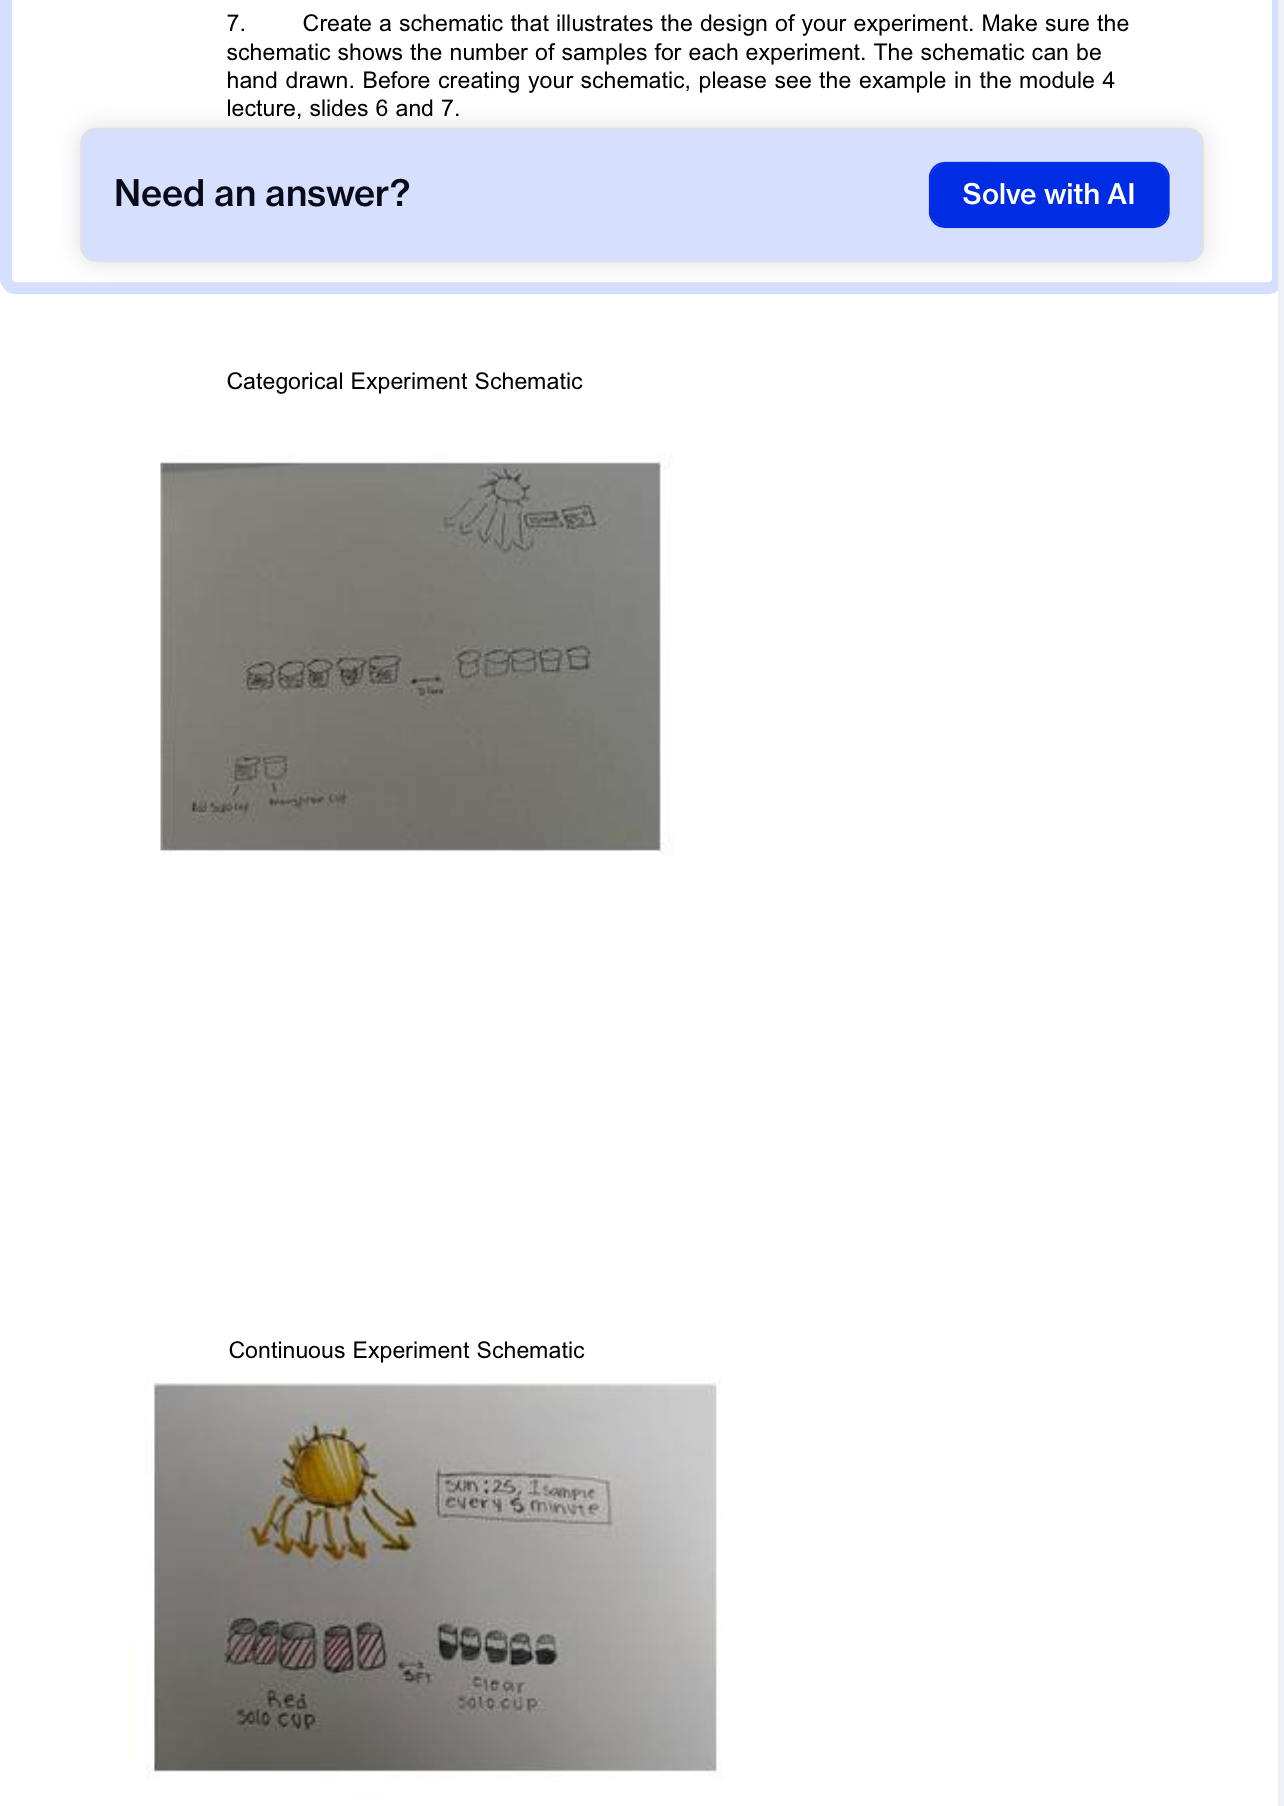
Temperature vs X Factor Experiment Approval Form. Directions: Please answer the following questions about our experiment. There is an example in module 4 that provides details about this information. Incomplete proposals will be returned to the group for competition. This proposal must be approved by the instructor before you begin the experiment. 1. What is the scientific principle related to your experiment? Briefly describe the principle. Please see the example in the module 4 lecture, slide 5. Ideas: Color & Heat Absorption Different colored solo cups impact the temperature of the water they contain due to variations in light and heat absorption The solution is missing an explanation. Explain with Al 2. Briefly describe the temperature vs X factor experiment your group will conduct. How many samples will be collected in each experiment? Please see the example in the module 4 lecture, slide 5. Categorical Data Experiment: We will compare water temperature between a transparent solo cup and red solo cup sitting in the sun for 10 minutes. We will have 5 samples for each cup (color). Continuous Data Experiment: We will monitor the temperature change of the water for 25 minutes and collect 5 samples. 1 sample every 5 minutes from each of the 5 cups. The solution is missing an explanation. Explain with Al 3. For the continuous data experiment, what are the independent and dependent variables? Please see the example in the module 4 lecture, slide 5. Dependent Variable : Liquid temperature Independent Variable : The Sun The solution is missing an explanation. Explain with Al 4, For the categorical data experiment, what are the dependent and independent variables and treatment and control variables? Please see the example in the module 4 lecture, slide 5. Dependent Variable: Liquid Temperature Independent Variable: The Sun 5. Create a graph that illustrates your hypothesized (predicted) results. The graphs can be hand drawn. Before creating your graph, please see the example in the module 4 lecture, slides 8 and 9. Need an answer? Solve with Al Categorical Graph: 6. List two experimental variables that you can control and two variables that you cannot control for each experiment type. Please see the example in the module 4 lecture, slide 5. Categorical Variables: Controlled Variables: Water volume, Water starting temperature, Type of thermometer Uncontrolled Variables: Precision of thermometer, The Sun Continuous Variables: Controlled Variables: Container Type, Location of container, water volume Uncontrolled Variables: Weather change, Humidity The solution is missing an explanation. Explain with Al 7 Create a schematic that illustrates the design of your experiment. Make sure the schematic shows the number of samples for each experiment. The schematic can be hand drawn. Before creating your schematic, please see the example in the module 4 lecture, slides 6 and 7. Need an answer? LY\\ Categorical Experiment Schematic Continuous Experiment Schematic 8. Briefly describe the video you will create showing the experiment. Please see the example in module 4 lecture, slide 10. How will you show each sample being collected and measured? What information will you provide in the video? We''ll measure % of each solo cup (9 fl oz) of water for both cup types (colors), place them outside in the sun, start a stopwatch for 10 minutes, and conduct our data collection. Then begin our continuous data experiment, show the liquid amount in each cup, start the stopwatch for 25 minutes, and conduct data collection in 5-minute intervals. We will provide additional information about the initial temperature of the water in the cups and the temperature of the sun. The solution is missing an explanation. Explain with Al
Step by Step Solution
There are 3 Steps involved in it
Step: 1
Get Instant Access to Expert-Tailored Solutions
See step-by-step solutions with expert insights and AI powered tools for academic success
Step: 2
Step: 3
Ace Your Homework with AI
Get the answers you need in no time with our AI-driven, step-by-step assistance