Please help answer the questions below using my graphs i pasted below please help me.
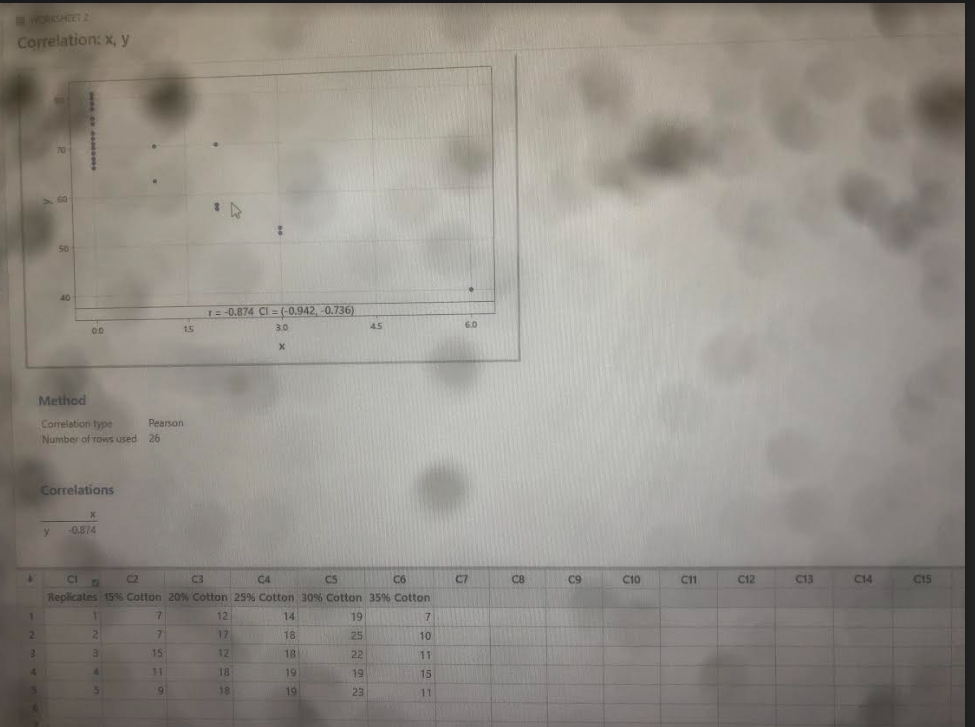
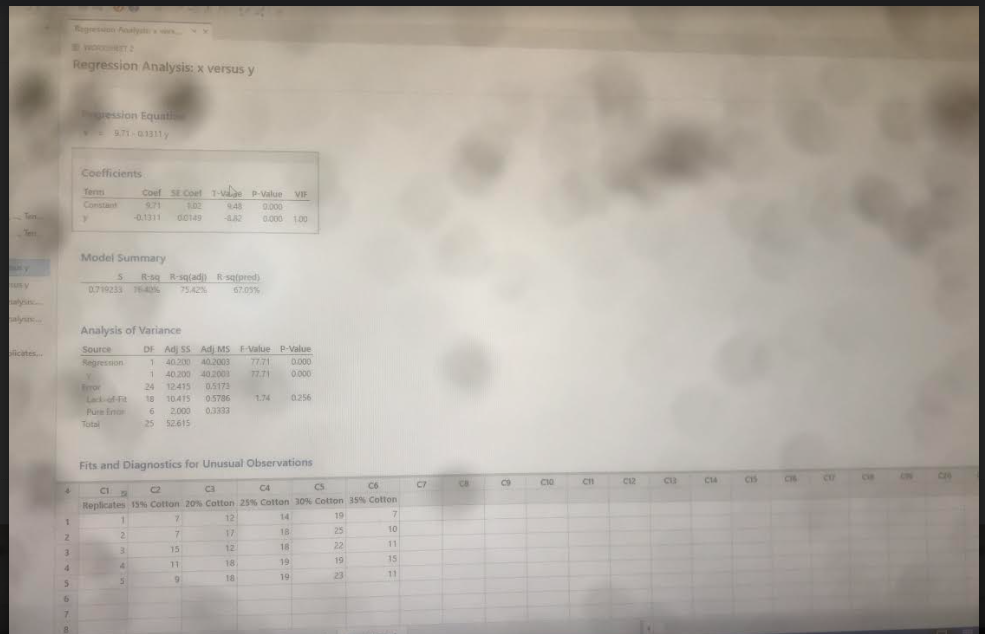
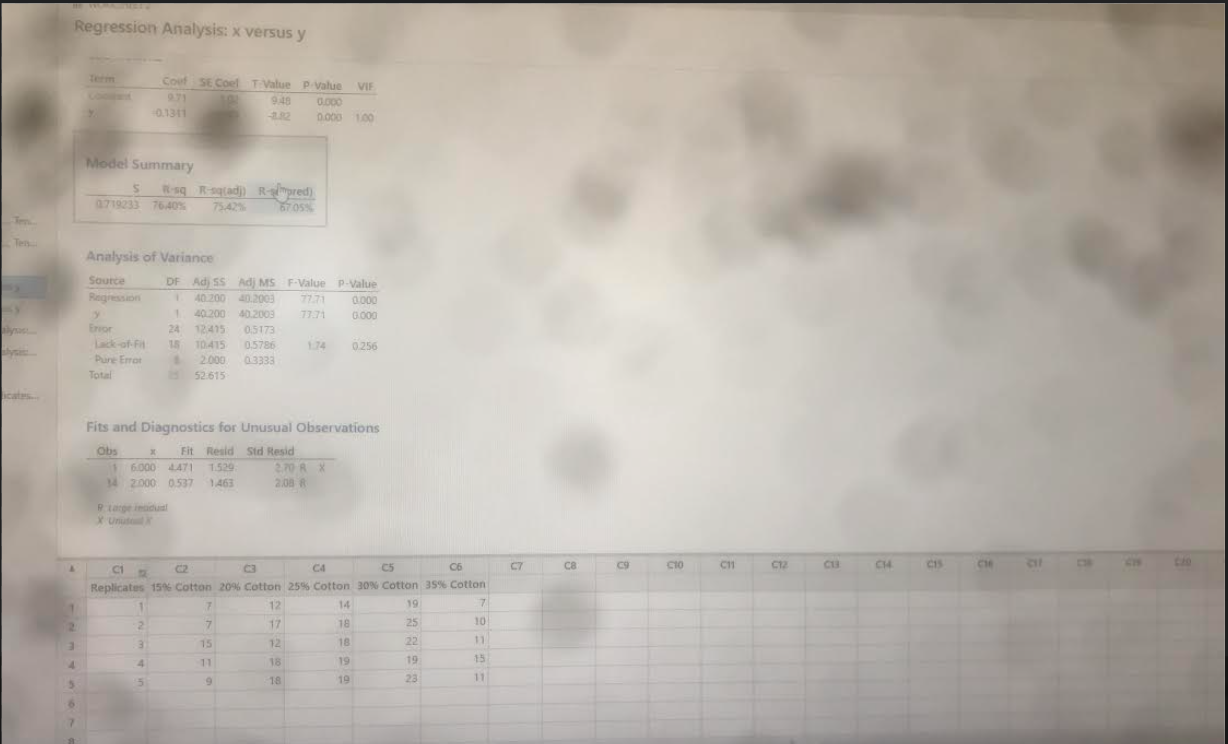
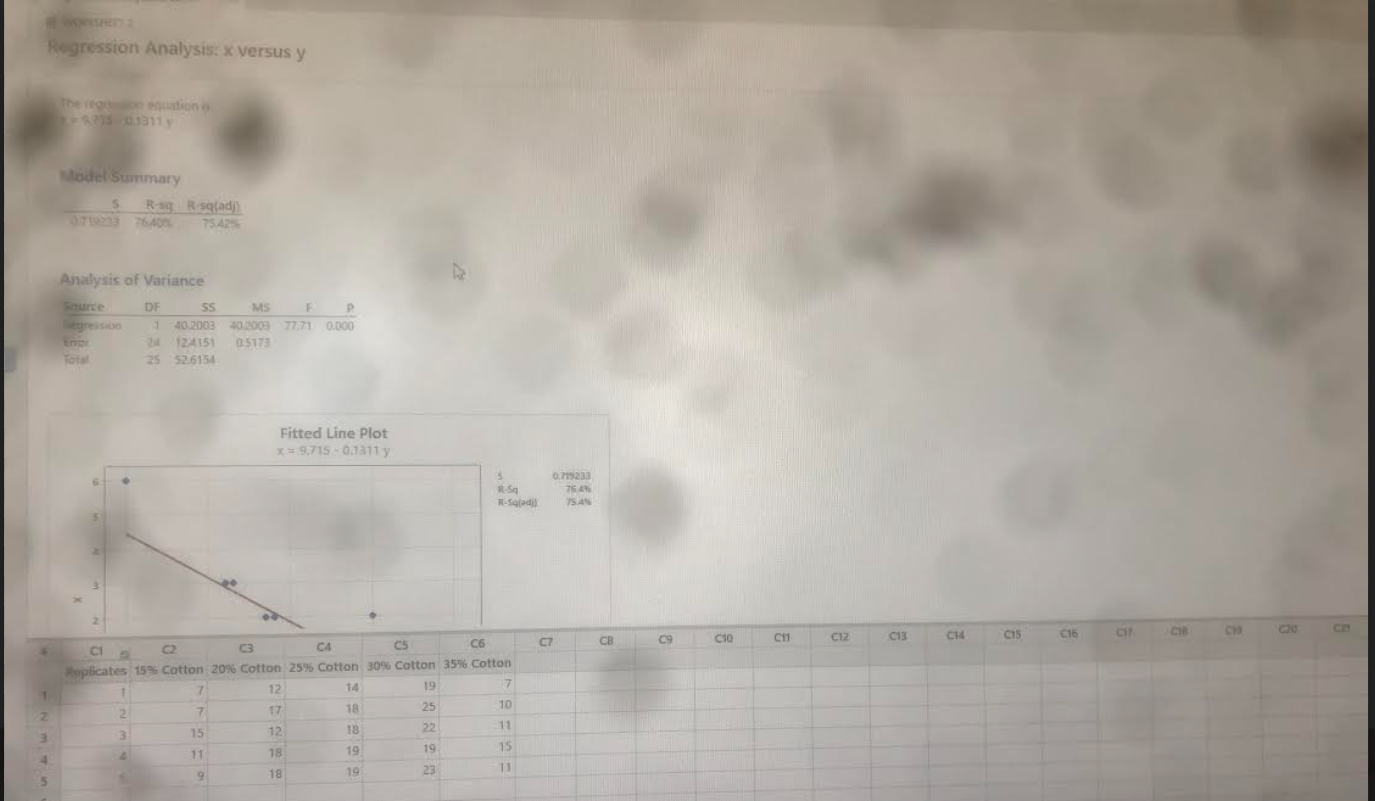
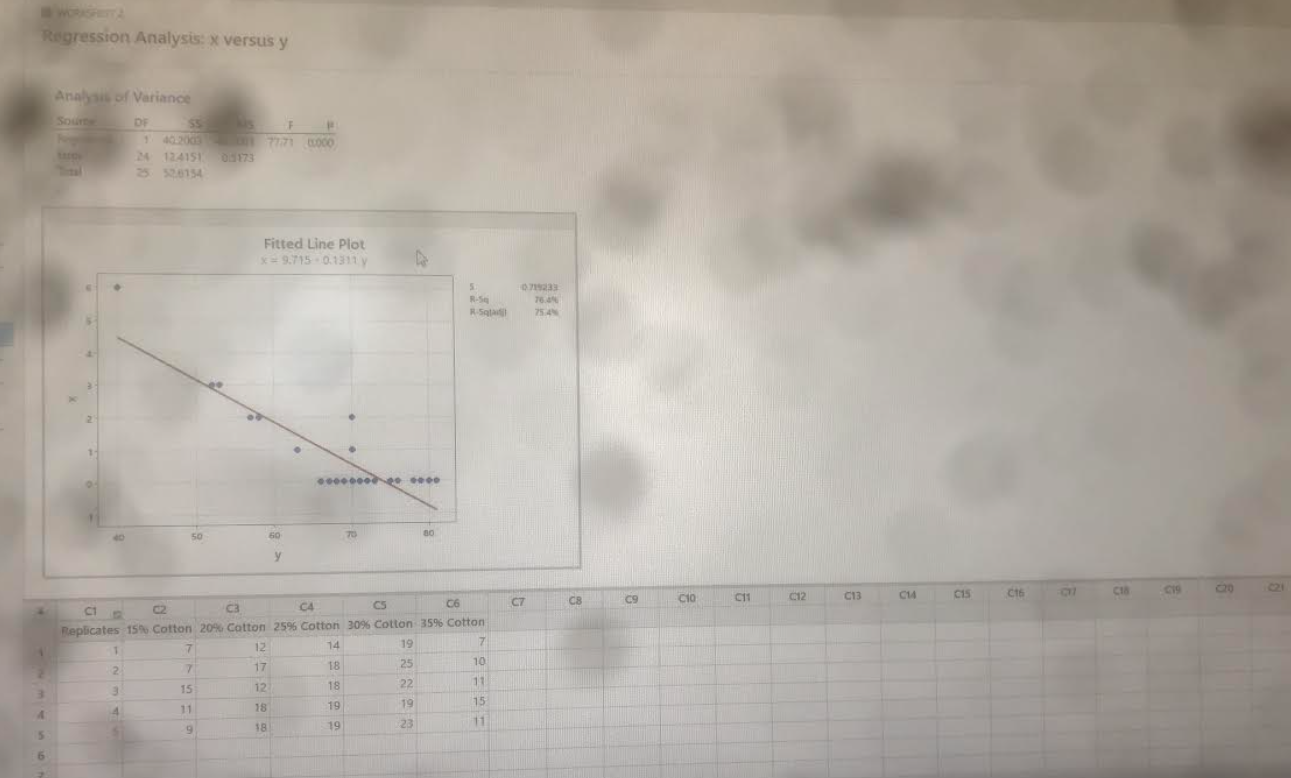
WORKSHEET 2 Correlation: x, y s k I =-0.874 CI = (-0.942, -0.736) 15 3.0 45 6.D Method Correlation type Pearson Number of rows used 26 Correlations y -0.874 CI C2 C3 C4 CS C6 C7 CB C9 Clo C11 C12 C13 C14 C15 Replicates 15% Cotton 20% Cotton 25% Cotton 30% Cotton 35% Cotton 12 14 19 17 17 18 25 10 15 12 18 22 11 18 19 19 15 18 19 23 11Regression Analysis: x versus y Profession Equates 971 01311y Coefficients Tent Coef SE cort T-yde P-Value VIF Constant 9.71 1.02 948 5.000 -0.1311 00149 0,000 1:00 Tell Model Summary R-sq R-sqladj) R-solpred) 0719233 76 4016 75,42% 67.05%% Analysis of Variance lightes... Source DF Adj SS Adj MS F Value P-Value Regression 40.200 40.2003 77:71 40209 40.2001 Frror 24 12415 0.5173 18 10415 0:5796 1.74 0256 Pure Inor 6 2000 0.3233 Total 25 52615 Fits and Diagnostics for Unusual Observations CD C12 CIR CES CI Ca CA CS C6 Replicates 15% Cotton 20% Cotton 25% Colton 30% Cotton 35% Cotton 7 12 14 19 25 LO 2 7 18 15 12 18 22 11 11 18 19 19 15Regression Analysis: x versus y Coof SE Coel T Value P.Value VIE 948 0.000 0.1311 0.000 100 Model Summary R-sq R-equadj) R-pumpred) 0719233 76:40% 7542% 67 05% Jim Ten Analysis of Variance Source DF Ad SS Adj MS F-Value P-Value Ragression 40 200 40.2008 72.71 40.200 40.2009 7371 0.00 Error 24 12 415 05173 Lack of. Fit 10:415 0,5786 174 0.256 Pure Errot 2:000 03333 Total 52:615 icafes.. Fits and Diagnostics for Unusual Observations Obs Fit Reald Sid Resid 6:000 4471 1529 270 8 X 14 2:000 0.537 1463 2.08 8 P Large inadual Unisond i C2 C3 CA C5 C6 C7 C8 C9 C10 C11 C12 CH Replicates 15% Cotton 20% Cotton 25% Cotton 30% Cotton 35% Cotton 12 14 19 7 17 18 25 10 15 12 18 22 11 I w 71 18 19 19 15 18 19 23 11Regression Analysis: x versus y The region equation Model Summary S R-ag R-squad) 0.710233 76400 75 42% Analysis of Variance Source DF SS MS greasion 40.2003 40.2003 77.71 0.000 24 124151 0:5173 Total 25 52.6154 Fitted Line Plot x = 9.715-0.131Ty S 0.719233 R.Sa 76 41 75.AN CZ C3 CA C5 C6 C7 CB C9 C10 C11 CIZ C13 CH C15 C16 CH C20 Replicates 15% Cotton 20% Cotton 25% Cotton 30% Cotton 35% Cotton 7 12 14 19 7 17 18 25 10 W N 15 12 18 22 11 11 18 19 19 15 g 18 19 23 11Regression Analysis: x versus y Analysis of Variance OF SS 1 46.2003 1 77:71 6:060 24 124151 0173 125 520154 Fitted Line Plot x = 9.715 - 0.1317 y 75 4 50 60 80 CIA C20 C21 CA CS 06 C7 C8 C9 C10 C11 C12 C13 C14 C15 C2 C3 Replicates 15%% Cotton 20 Cotton 25% Cotton 30% Cotton 35% Cotton 12 14 19 7 10 7 17 18 25 15 12 18 22 11 18 19 19 15 11 19 23 11Doproof equinon is Model Summary R-sq R-sqlagn 89 06% Analysis of Variance Source OF SS MS F P Regression 2 47,3189 23.6595 10274 0.000 123 5.2965 02303 25 52.6154 Sequential Analysis of Variance Source OF SS P Linear ALL 2003 77.71 0.000 Quadratic 1 7,1486 30.91 0.000 Fitted Line Plot x = 26 22 -0/6731 40.004314 12Sequential Analysis of Variance Source P 46:20037 7.1 186 Fitted Line Plot - 26.22 -0.6731 y - 0 004314 y42 R.54 K-Saladj 59 TH 60 70 y C3 C4 C5 C6 C7 C8 C9 C10 C12 C13 CH C15 C16 C17 CIN C20 Replicates 15% Cotton 20% Cotton 25% Cotton 30% Cotton 35% Cotton 12 14 19 7 17 18 25 10 15 12 18 22 11 15The fobression equation is . 1596 7 0:14By-0:00450 y42 4 0.000048 y^3 Model Summary S R-sq R-sq10 90 16% 88 ME Analysis of Variance Source DF SS MS F P Regression 3 47:4377 15,8126 67/19 0.000 Error 22 5.1777 62453 25 52 6154 Sequential Analysis of Variance Source OF SS F P Uineat 1 402003 77.71 0.000 Quadratic T 7 1186 30,91 0.000 Cubic 0.50 0.485 Fitted Line Plot x = 15.96 - 0.1439 y 0.00450 y^2 4 0.000048 y B C13 C14 CIS C16 C17 CT9Sequential Analysis of Variance P 40 2003 72.71 0:080 (.600 Cube 0485 Fitted Line Plot x = $5.96 -0.1439 y - 0.00450 y02 - 0:000048 Y43 0.485128 R.5q 50.2% N-Sqfadil 50 70 80 4 C2 C3 CA C5 C6 C7 Ca C9 C10 C11 C12 C13 C14 C15 C16 C20 Replicates 1536 Cotton 20% Cotton 25% Cotton 30% Cotton 35% Cotton 7 12 14 19 17 18 25 10 15 12 18 22 11 11 18 19 19 15 18 19 11