Answered step by step
Verified Expert Solution
Link Copied!

Question

1 Approved Answer

prove that x and y are perfectly negatively correlated. 5.3 Given the following hypothetical end-of-period prices for shares of the Drill-On Corporation, Probability .15 End-of-period
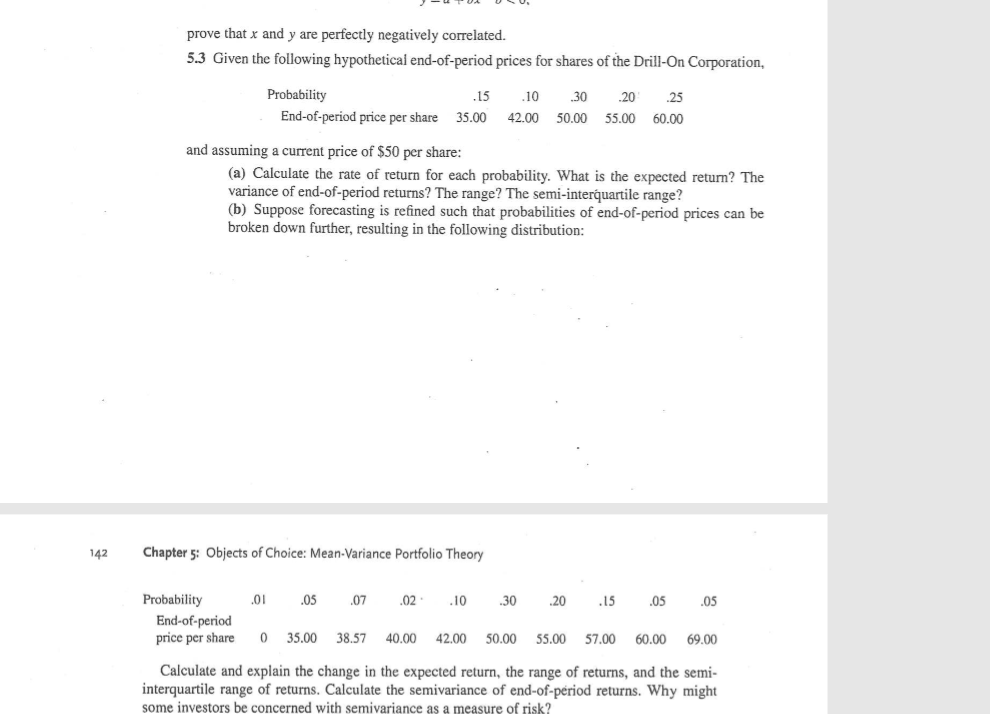
image text in transcribed

prove that x and y are perfectly negatively correlated. 5.3 Given the following hypothetical end-of-period prices for shares of the Drill-On Corporation, Probability .15 End-of-period price per share 35.00 .10 42.00 .30 .20 .25 50.00 55.00 60.00 and assuming a current price of $50 per share: (a) Calculate the rate of return for each probability. What is the expected return? The variance of end-of-period returns? The range? The semi-interquartile range? (b) Suppose forecasting is refined such that probabilities of end-of-period prices can be broken down further, resulting in the following distribution: 142 Chapter 5: Objects of Choice: Mean-Variance Portfolio Theory .01 .05 .07 .02 .10 .30 .20 .15 .05 .05 Probability End-of-period price per share 0 35.00 38.57 40.00 42.00 50.00 55.00 57.00 60.00 69.00 Calculate and explain the change in the expected return, the range of returns, and the semi- interquartile range of returns. Calculate the semivariance of end-of-period returns. Why might some investors be concerned with semivariance as a measure of risk? prove that x and y are perfectly negatively correlated. 5.3 Given the following hypothetical end-of-period prices for shares of the Drill-On Corporation, Probability .15 End-of-period price per share 35.00 .10 42.00 .30 .20 .25 50.00 55.00 60.00 and assuming a current price of $50 per share: (a) Calculate the rate of return for each probability. What is the expected return? The variance of end-of-period returns? The range? The semi-interquartile range? (b) Suppose forecasting is refined such that probabilities of end-of-period prices can be broken down further, resulting in the following distribution: 142 Chapter 5: Objects of Choice: Mean-Variance Portfolio Theory .01 .05 .07 .02 .10 .30 .20 .15 .05 .05 Probability End-of-period price per share 0 35.00 38.57 40.00 42.00 50.00 55.00 57.00 60.00 69.00 Calculate and explain the change in the expected return, the range of returns, and the semi- interquartile range of returns. Calculate the semivariance of end-of-period returns. Why might some investors be concerned with semivariance as a measure of risk

Step by Step Solution

There are 3 Steps involved in it

Step: 1

blur-text-image

Get Instant Access to Expert-Tailored Solutions

See step-by-step solutions with expert insights and AI powered tools for academic success

Step: 2

blur-text-image_2

Step: 3

blur-text-image_3

Ace Your Homework with AI

Get the answers you need in no time with our AI-driven, step-by-step assistance

Get Started

Recommended Textbook for

Retail Industry IRS Audit Technique Guide

Authors: Internal Revenue Service

1st Edition

1304114783, 978-1304114785

More Books

Students also viewed these Accounting questions