Answered step by step
Verified Expert Solution
Question
1 Approved Answer
provide a cropped image of the PIVOT results for that group (provide some analysis of them) provide the SQL statement used to generate that


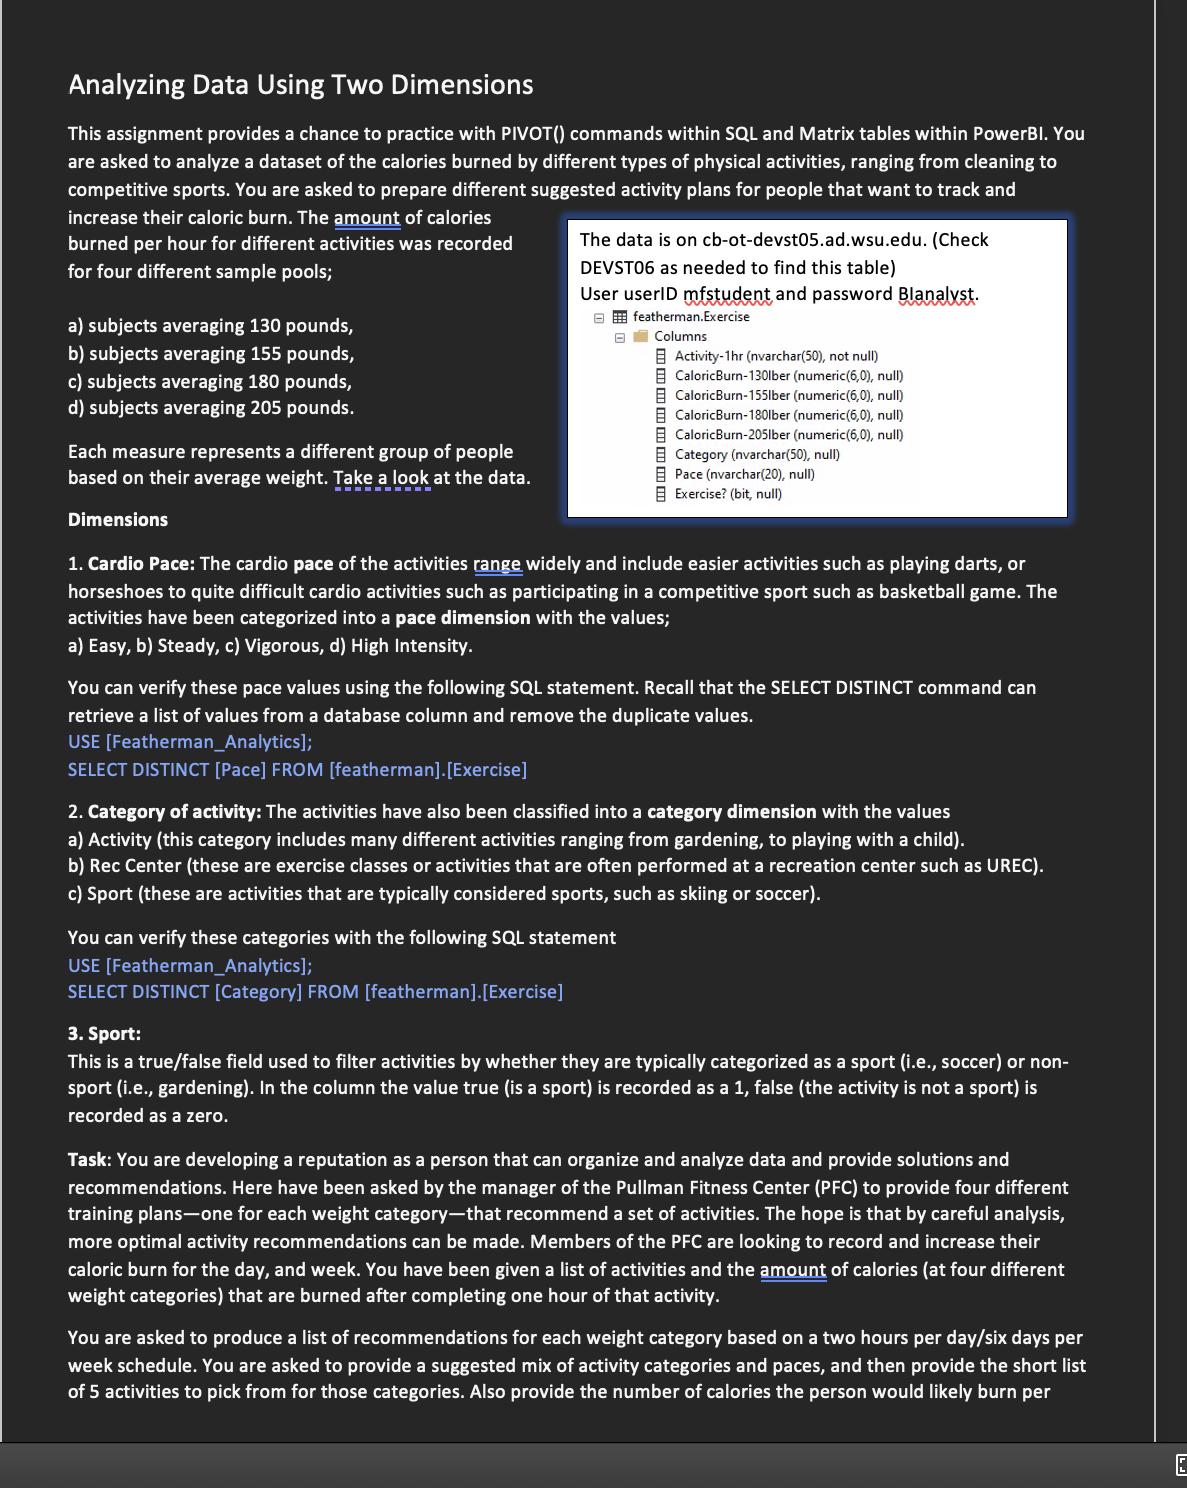
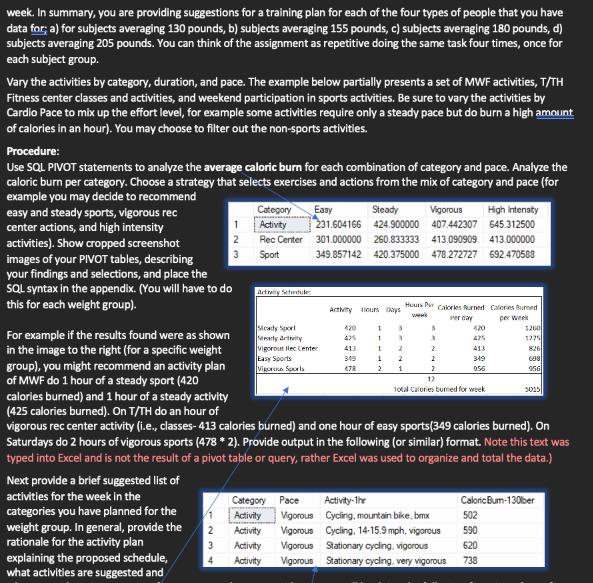
provide a cropped image of the PIVOT results for that group (provide some analysis of them) provide the SQL statement used to generate that result (place in the appendix) provide the Activity schedule you plan for the weight group (provide your rationale for that schedule) provide a short list of actions that fit the Activity schedule. Note (the PIVOT results are averages so you may choose to ovide a more specific action schedule based on the suggested activities). You are generating a list of suggested tivities for rec center members, so give 3-5 options per suggested activity group (i.e. Choose gardening, walking, or aying with a child for the easy activities on MWF). Tie the images and activities together into an Activity Recommendation Plan and description such as "To hit the goal 5000 calories burned per week, we suggest the following activities as follows..." Analyzing Data Using Two Dimensions This assignment provides a chance to practice with PIVOT () commands within SQL and Matrix tables within PowerBI. You are asked to analyze a dataset of the calories burned by different types of physical activities, ranging from cleaning to competitive sports. You are asked to prepare different suggested activity plans for people that want to track and increase their caloric burn. The amount of calories burned per hour for different activities was recorded for four different sample pools; a) subjects averaging 130 pounds, b) subjects averaging 155 pounds, c) subjects averaging 180 pounds, d) subjects averaging 205 pounds. Each measure represents a different group of people based on their average weight. Take a look at the data. Dimensions The data is on cb-ot-devst05.ad.wsu.edu. (Check DEVST06 as needed to find this table) User userID mfstudent and password Blanalyst. featherman.Exercise B Columns Activity-1hr (nvarchar(50), not null) CaloricBurn-130lber (numeric (6,0), null) CaloricBurn-155lber (numeric (6,0), null) CaloricBurn-180lber (numeric (6,0), null) CaloricBurn-205lber (numeric (6,0), null) Category (nvarchar(50), null) Pace (nvarchar(20), null) Exercise? (bit, null) 1. Cardio Pace: The cardio pace of the activities range widely and include easier activities such as playing darts, or horseshoes to quite difficult cardio activities such as participating in a competitive sport such as basketball game. The activities have been categorized into a pace dimension with the values; a) Easy, b) Steady, c) Vigorous, d) High Intensity. You can verify these pace values using the following SQL statement. Recall that the SELECT DISTINCT command can retrieve a list of values from a database column and remove the duplicate values. USE [Featherman_Analytics]; SELECT DISTINCT [Pace] FROM [featherman]. [Exercise] You can verify these categories with the following SQL statement USE [Featherman_Analytics]; SELECT DISTINCT [Category] FROM [featherman]. [Exercise] 2. Category of activity: The activities have also been classified into a category dimension with the values a) Activity (this category includes many different activities ranging from gardening, to playing with a child). b) Rec Center (these are exercise classes or activities that are often performed at a recreation center such as UREC). c) Sport (these are activities that are typically considered sports, such as skiing or soccer). 3. Sport: This is a true/false field used to filter activities by whether they are typically categorized as a sport (i.e., soccer) or non- sport (i.e., gardening). In the column the value true (is a sport) is recorded as a 1, false (the activity is not a sport) is recorded as a zero. Task: You are developing a reputation as a person that can organize and analyze data and provide solutions and recommendations. Here have been asked by the manager of the Pullman Fitness Center (PFC) to provide four different training plans-one for each weight category-that recommend a set of activities. The hope is that by careful analysis, more optimal activity recommendations can be made. Members of the PFC are looking to record and increase their caloric burn for the day, and week. You have been given a list of activities and the amount of calories (at four different weight categories) that are burned after completing one hour of that activity. You are asked to produce a list of recommendations for each weight category based on a two hours per day/six days per week schedule. You are asked to provide a suggested mix of activity categories and paces, and then provide the short list of 5 activities to pick from for those categories. Also provide the number of calories the person would likely burn per week. In summary, you are providing suggestions for a training plan for each of the four types of people that you have data for; a) for subjects averaging 130 pounds, b) subjects averaging 155 pounds, c) subjects averaging 180 pounds, d) subjects averaging 205 pounds. You can think of the assignment as repetitive doing the same task four times, once for each subject group. Vary the activities by category, duration, and pace. The example below partially presents a set of MWF activities, T/TH Fitness center classes and activities, and weekend participation in sports activities. Be sure to vary the activities by Cardio Pace to mix up the effort level, for example some activities require only a steady pace but do burn a high amount of calories in an hour). You may choose to filter out the non-sports activities. Procedure: Use SQL PIVOT statements to analyze the average caloric burn for each combination of category and pace. Analyze the caloric burn per category. Choose a strategy that selects exercises and actions from the mix of category and pace (for example you may decide to recommend easy and steady sports, vigorous rec center actions, and high intensity activities). Show cropped screenshot Next provide a brief suggested list of activities for the week in the categories you have planned for the weight group. In general, provide the rationale for the activity plan explaining the proposed schedule, what activities are suggested and 1 images of your PIVOT tables, describing your findings and selections, and place the SQL syntax in the appendix. (You will have to do this for each weight group). /1 23 23 3 Category Easy Steady Vigorous High Intensity Activity 231.604166 424.900000 407.442307 645.312500 Rec Center 301.000000 260.833333 413.090909 413.000000 Sport 349.857142 420.375000 478.272727 692.470588 Activity Schedule Steady Sport Stety Activity vigorous Rec Center Easy Sports Vigor Sports Category Pace Activity Vigorous Activity Vigorous Activity Vigorous Vigorous Activity lours Days 420 475 413 349 478 4 Activity For example if the results found were as shown in the image to the right (for a specific weight group), you might recommend an activity plan of MWF do 1 hour of a steady sport (420 calories burned) and 1 hour of a steady activity (425 calories burned). On T/TH do an hour of vigorous rec center activity (i.e., classes-413 calories burned) and one hour of easy sports(349 calories burned). On Saturdays do 2 hours of vigorous sports (478 * 2). Provide output in the following (or similar) format. Note this text was typed into Excel and is not the result of a pivot table or query, rather Excel was used to organize and total the data.) 1 3 1 Y Huur Pur Calories Aurned week ver day I 1 2 2 2 1 2 2 2 420 425 413 349 956 12 Total Calories burned for week Activity-1hr Cycling, mountain bike, bmx Cycling, 14-15.9 mph, vigorous Stationary cycling, vigorous Stationary cycling, very vigorous Calories Rurned per week 1260 1275 826 698 956 3015 Caloric Burm-130%ber 502 590 620 738 You are creating four different activity plans, one for each weight group. Final note: At the end of the document provide your thoughts as to two threats to the validity of the recommendations. List two problems that might be evident with the data in the dataset, which would call into question the validity of your analysis and recommendations for activity plans. Upload your report to the content management system. You have complete design authority to produce the output requested. Better grades for completeness, thoughtfulness, and formatting. Keep reports in the 4-7 page range including images and the appendix of SQL.
Step by Step Solution
There are 3 Steps involved in it
Step: 1

Get Instant Access to Expert-Tailored Solutions
See step-by-step solutions with expert insights and AI powered tools for academic success
Step: 2

Step: 3

Ace Your Homework with AI
Get the answers you need in no time with our AI-driven, step-by-step assistance
Get Started


