Answered step by step
Verified Expert Solution
Link Copied!

Question

1 Approved Answer

Provide a short description of your data, make a proposal on how you can use this data to forecast future values, and discuss the necessary

  1. Provide a short description of your data, make a proposal on how you can use this data to forecast future values, and discuss the necessary assumption you made in order to conduct a meaningful forecasting.

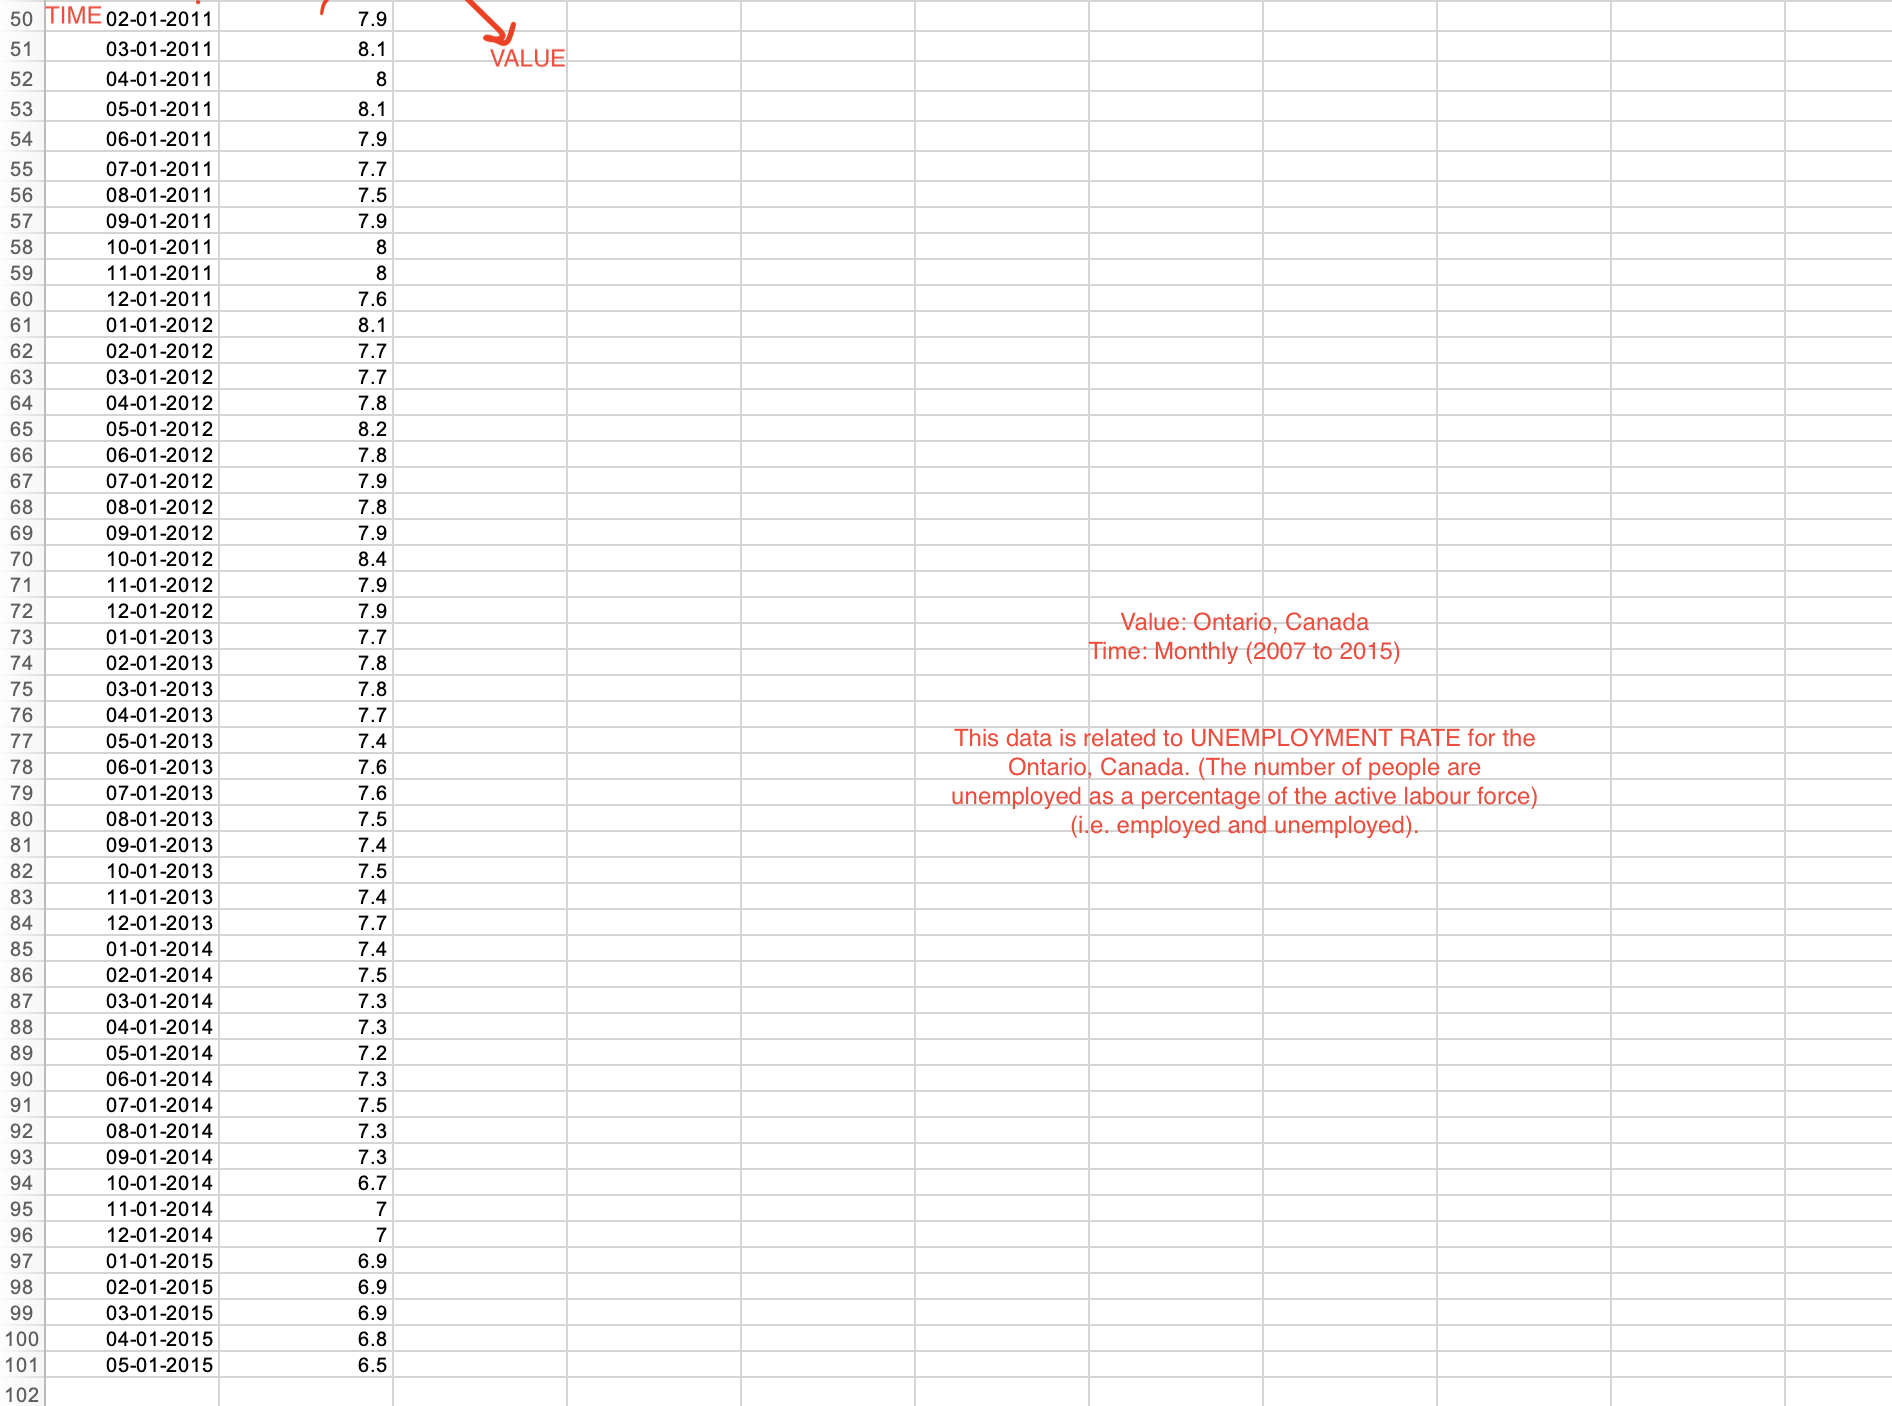
I have attached the data below. This data is related to Unemployment Rate of Ontario from 2007 to 2015. This data used for R-studio for calculation ACF and time series plot. Therefore, could you please make a proposal on how you can use this data to forecast future values, and discuss the necessary assumption you made in order to conduct a meaningful forecasting? (Could you please explain in detail?) Thank you very much in advance!

image text in transcribed
50 TIME 02-01-2011 7.9 51 03-01-2011 8.1 VALUE 52 04-01-2011 8 53 05-01-2011 8.1 54 06-01-2011 7.9 55 07-01-2011 7.7 56 08-01-2011 7.5 57 09-01-2011 79 58 10-01-2011 8 59 11-01-2011 8 60 12-01-2011 7.6 61 01-01-2012 8.1 62 02-01-2012 7.7 63 03-01-2012 7.7 64 04-01-2012 7.8 65 05-01-2012 8.2 66 06-01-2012 7.8 67 07-01-2012 7.9 68 08-01-2012 7.8 69 09-01-201 7.9 70 10-01-2012 8.4 71 11-01-2012 7.9 72 12-01-2012 7.9 Value: Ontario, Canada 73 01-01-2013 7.7 74 02-01-2013 Time: Monthly (2007 to 2015) 7.8 75 03-01-2013 7.8 76 04-01-2013 7.7 05-01-2013 7.4 This data is related to UNEMPLOYMENT RATE for the 78 06-01-2013 7.6 Ontario, Canada. (The number of people are 79 07-01-2013 7.6 unemployed as a percentage of the active labour force) 80 08-01-2013 7.5 (i.e. employed and unemployed). 81 09-01-2013 7.4 82 10-01-2013 7.5 83 11-01-2013 7.4 84 12-01-2013 7.7 85 01-01-2014 7.4 86 02-01-2014 7.5 87 03-01-2014 7.3 88 04-01-2014 7.3 89 05-01-2014 7.2 90 06-01-2014 7.3 91 07-01-2014 7.5 92 08-01-2014 7.3 93 09-01-2014 7.3 94 10-01-2014 6.7 95 11-01-2014 7 96 12-01-2014 97 01-01-2015 6.9 98 02-01-2015 6.9 99 03-01-2015 6.9 100 04-01-2015 6.8 01 05-01-2015 6 5 102

Step by Step Solution

There are 3 Steps involved in it

Step: 1

blur-text-image

Get Instant Access to Expert-Tailored Solutions

See step-by-step solutions with expert insights and AI powered tools for academic success

Step: 2

blur-text-image

Step: 3

blur-text-image

Ace Your Homework with AI

Get the answers you need in no time with our AI-driven, step-by-step assistance

Get Started

Recommended Textbook for

Calculus

Authors: Laura Taalman, Peter Kohn

1st Edition

1464153035, 9781464153037

More Books

Students also viewed these Mathematics questions