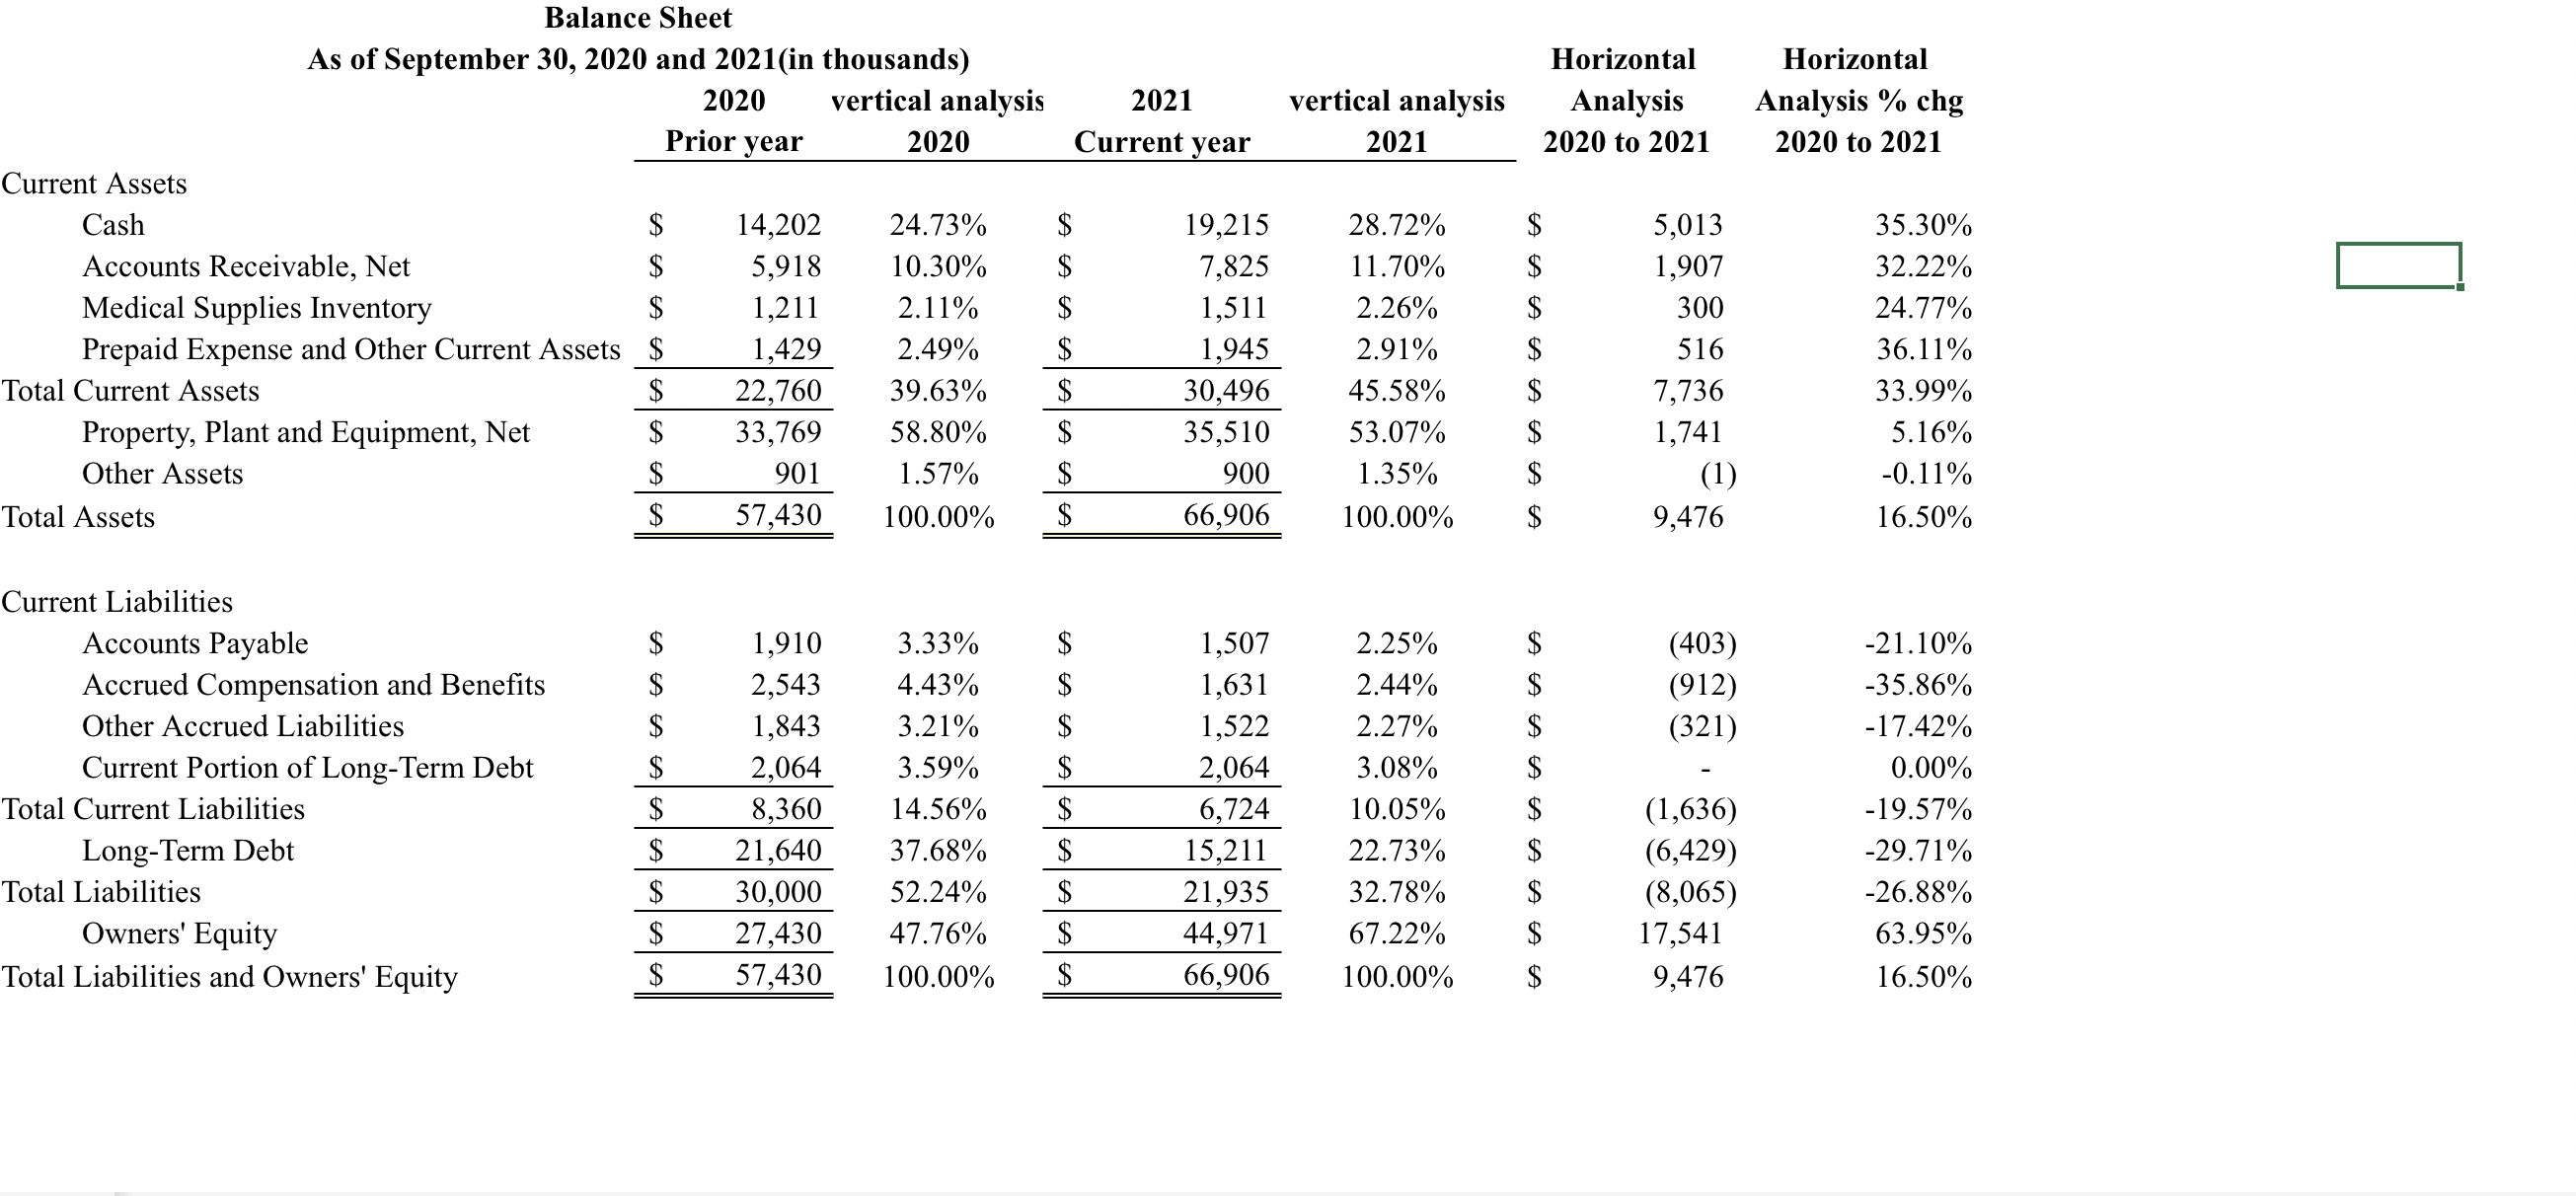
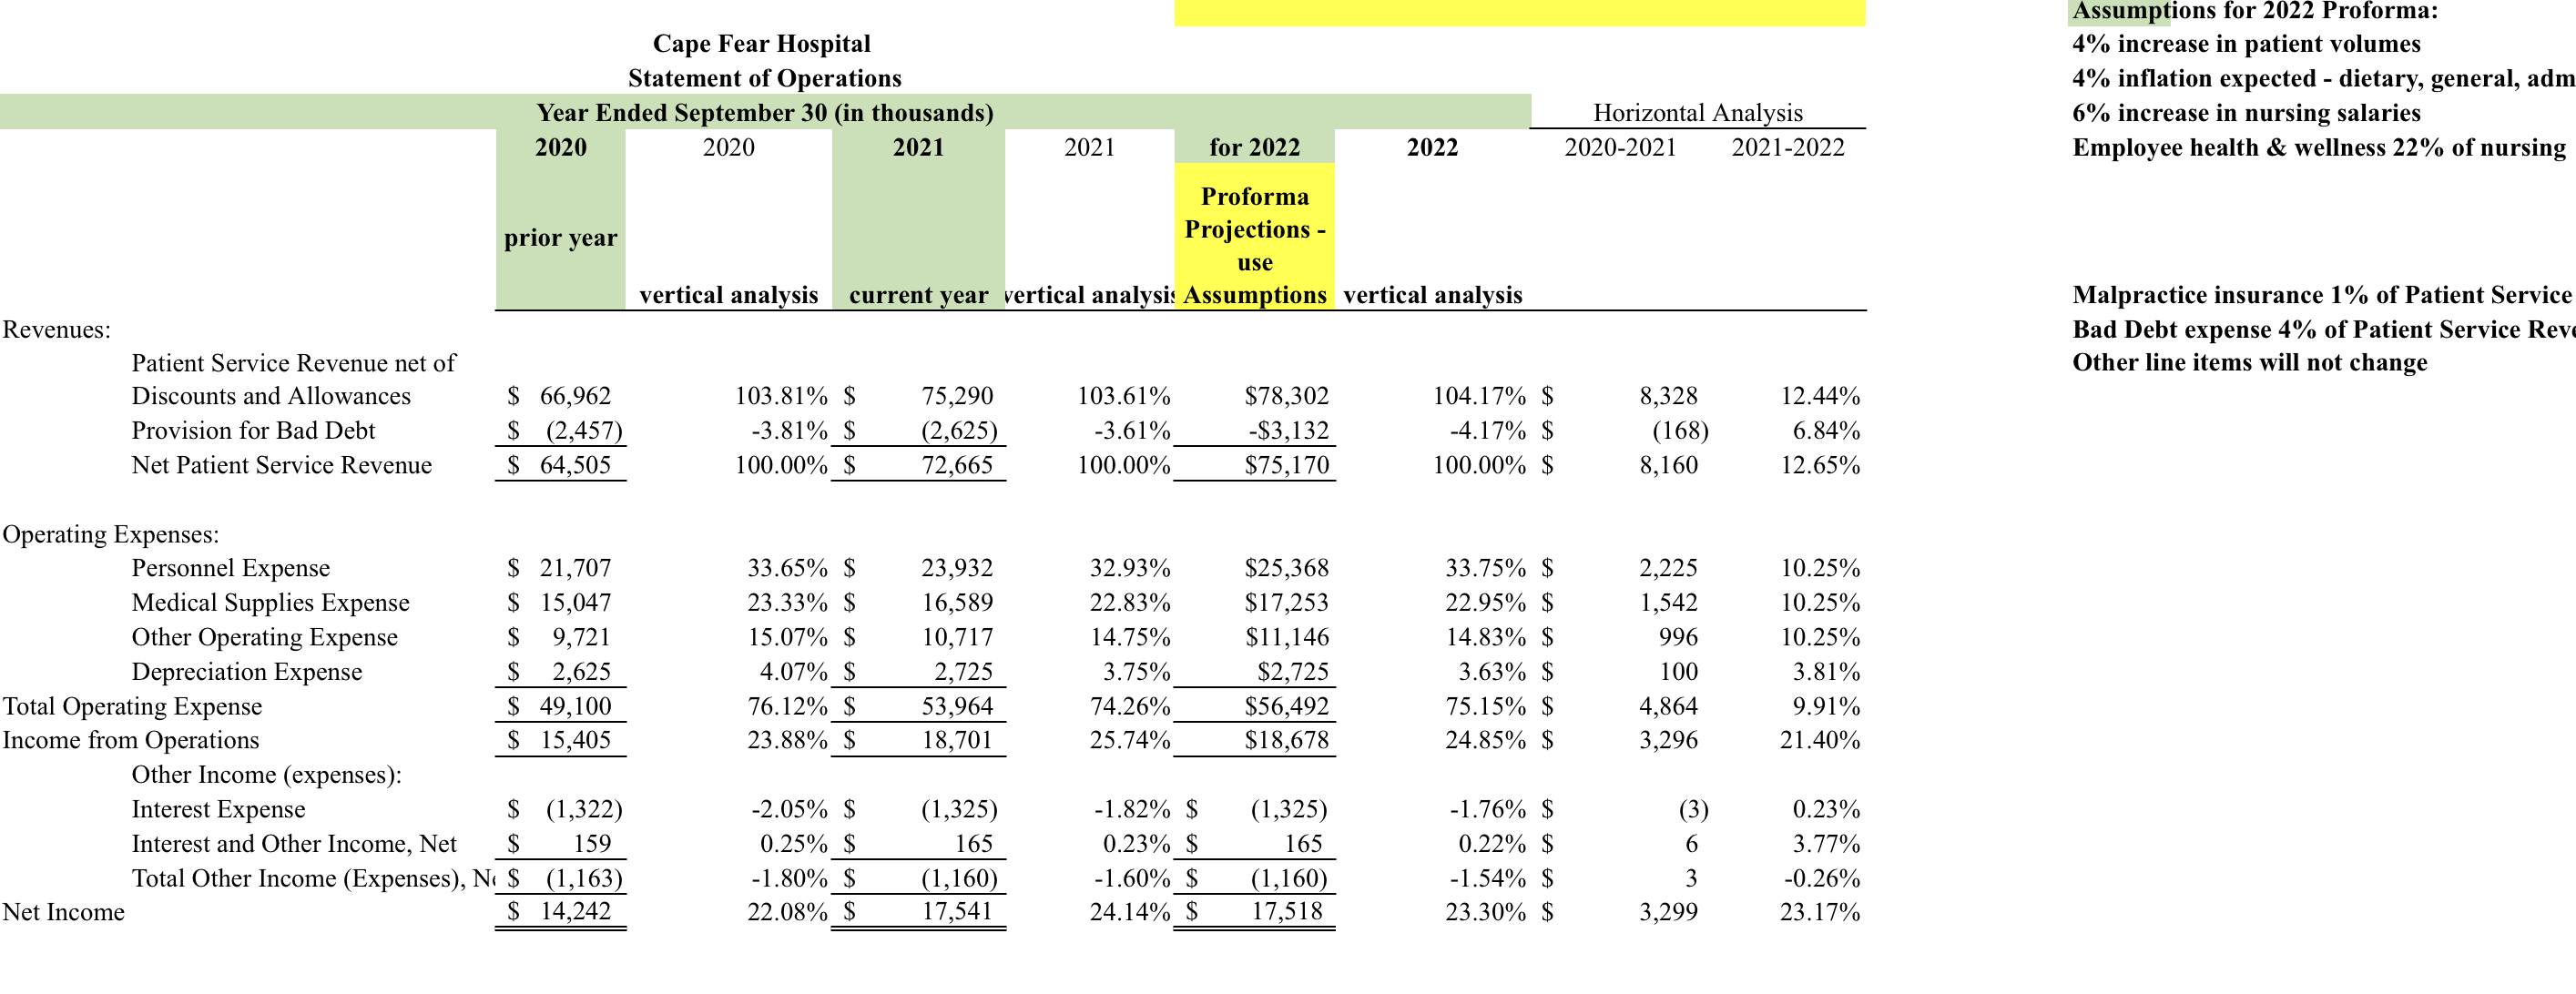
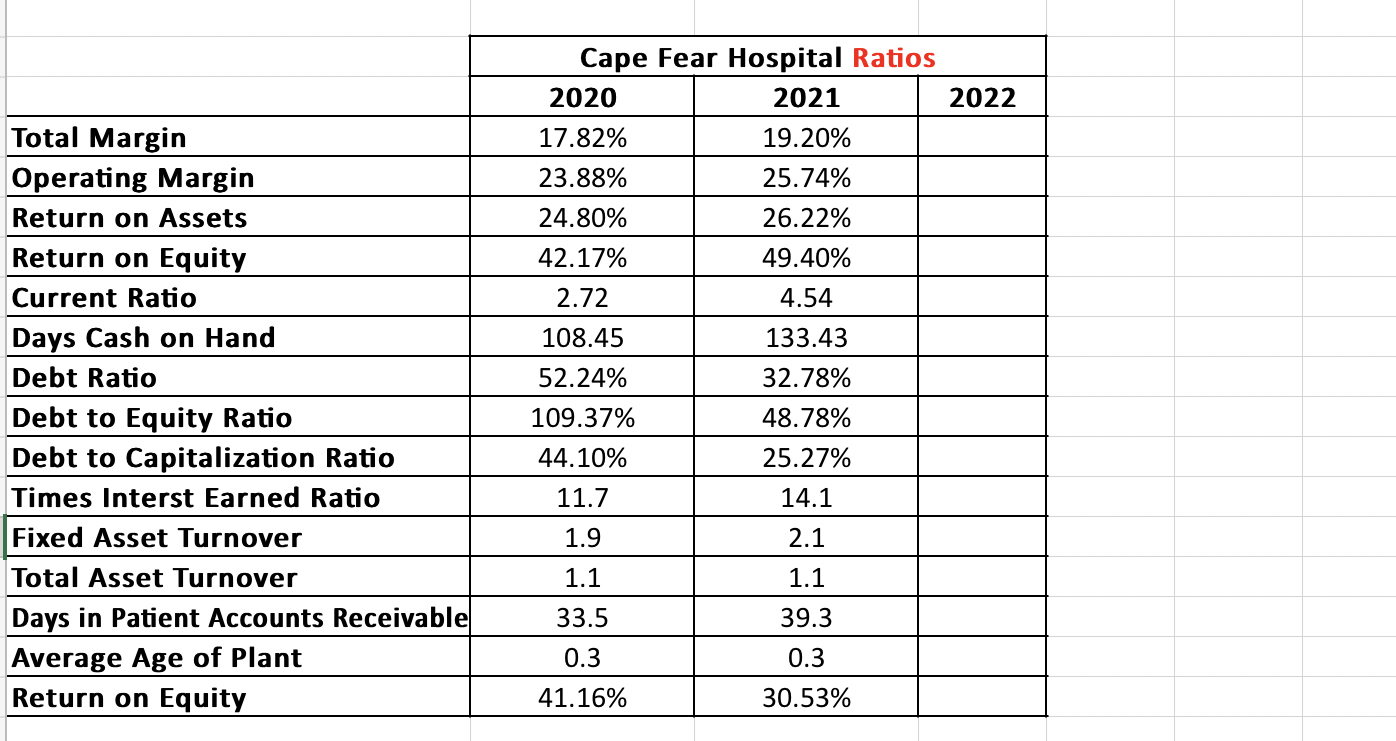
Provide a summary of the financial health of Cape Fear Hospital
In which areas is the organization doing well, and in which areas are there opportunities to improve? What about days in patient account receivables
Balance Sheet As of September 30, 2020 and 2021(in thousands) Current Assets Cash Accounts Receivable, Net Medical Supplies Inventory Prepaid Expense and Other Current Assets Total Current Assets Property, Plant and Equipment, Net Other Assets Total Assets Current Liabilities Accounts Payable Accrued Compensation and Benets Other Accrued Liabilities Current Portion of LongTerm Debt Total Current Liabilities Long-Term Debt Total Liabilities Owners' Equity Total Liabilities and Owners' Equity 2020 vertical analysis 2021 vertical analysis Prior year 2020 Current year 2021 $ 14,202 24.73% $ 19,215 28.72% $ 5,918 10.30% $ 7,825 11.70% $ 1,211 2.11% $ 1,511 2.26% $ 1,429 2.49% $ 1,945 2.91% $ 22,760 39.63% $ 30,496 45.58% $ 33,769 58.80% $ 35,510 53.07% $ 901 1.57% $ 900 1.35% $ 57,430 100.00% $ 66,906 100.00% $ 1,910 3.33% $ 1,507 2.25% $ 2,543 4.43% $ 1,631 2.44% $ 1,843 3.21% $ 1,522 2.27% $ 2,064 3.59% $ 2,064 3.08% $ 8,360 14.56% $ 6,724 10.05% $ 21,640 37.68% $ 15,211 22.73% $ 30,000 52.24% $ 21,935 32.78% $ 27,430 47.76% $ 44,971 67.22% $ 57,430 100.00% $ 66,906 100.00% moaeaeeweeeaee 66666693656566999) Horizontal Analysis 2020 to 2021 i013 L907 300 516 1736 L741 (0 %476 (403) (912) (321) (L636) (6A29) (8,065) 17541 %476 Horizontal Analysis % chg 2020 to 2021 35.30% 32.22% 24.77% 36.11% 33.99% 5.16% -0.1 1% 16.50% -21.10% -35.86% -17.42% 0.00% -19.57% -29.71% -26.88% 63.95% 16.50% Cape Fear Hospital Statement of Operations Year Ended September 30 (in thousands) Horizontal Analysis 2020 2020 2021 2021 for 2022 2022 2020-2021 2021-2022 Proforma prior year Projections - use vertical analysis currentyear vertical analysis Assumptions vertical analysis Revenues: Patient Service Revenue net of Discounts and Allowances $ 66,962 103.81% $ 75,290 103.61% $78,302 104.17% $ 8,328 12.44% Provision for Bad Debt $ (2,457) -3.81% $ (2,625) -3.61% -$3,132 -4.17% $ (168) 6.84% Net Patient Service Revenue $ 64,505 100.00% $ 72,665 100.00% $75,170 100.00% $ 8,160 12.65% Operating Expenses: Personnel Expense $ 21,707 33.65% $ 23,932 32.93% $25,368 33.75% $ 2,225 10.25% Medical Supplies Expense $ 15,047 23.33% $ 16,589 22.83% $17,253 22.95% $ 1,542 10.25% Other Operating Expense $ 9,721 15.07% $ 10,717 14.75% $11,146 14.83% $ 996 10.25% Depreciation Expense $ 2,625 4.07% $ 2,725 3.75% $2,725 3.63% $ 100 3.81% Total Operating Expense $ 49,100 76.12% $ 53,964 74.26% $56,492 75.15% $ 4,864 9.91% Income from Operations $ 15,405 23.88% $ 18,701 25.74% $18,678 24.85% $ 3,296 21.40% Other Income (expenses): Interest Expense $ (1,322) -2.05% $ (1,325) 4.82% $ (1,325) -1.76% $ (3) 0.23% Interestand Other Income, Net 15 159 0.25% $ 165 0.23% $ 165 0.22% $ 6 3.77% Total Other Income (Expenses), N1 19 (1,163) 4.80% $ (1,160) 160% $ (1,160) 4.54% $ 3 -0.26% Net Income $ 14,242 22.08% $ 17,541 24.14% $ 17,518 23.30% $ 3,299 23.17% Assumptions for 2022 Proforma: 4% increase in patient volumes 4% ination expected - dietary, general, adm 6% increase in nursing salaries Employee health & wellness 22% of nursing Malpractice insurance 1% of Patient Service Bad Debt expense 4% of Patient Service Rew Other line items will not change Cape Fear Hospital Ratios 2020 2021 2022 Total Margin 17.82% 19.20% Operating Margin 23.88% 25.74% Return on Assets 24.80% 26.22% Return on Equity 42.17% 49.40% Current Ratio 2.72 4.54 Days Cash on Hand 108.45 133.43 Debt Ratio 52.24% 32.78% Debt to Equity Ratio 109.37% 48.78% Debt to Capitalization Ratio 44.10% 25.27% Times Interst Earned Ratio 11.7 14.1 Fixed Asset Turnover 1.9 2.1 Total Asset Turnover 1.1 1.1 Days in Patient Accounts Receivable 33.5 39.3 Average Age of Plant 0.3 0.3 Return on Equity 41.16% 30.53%


