Provide a trend analysis for the previous 5 years for key profit and cash flow figures of JBH. In addition provide a discussion of any noticeable trends or outliers.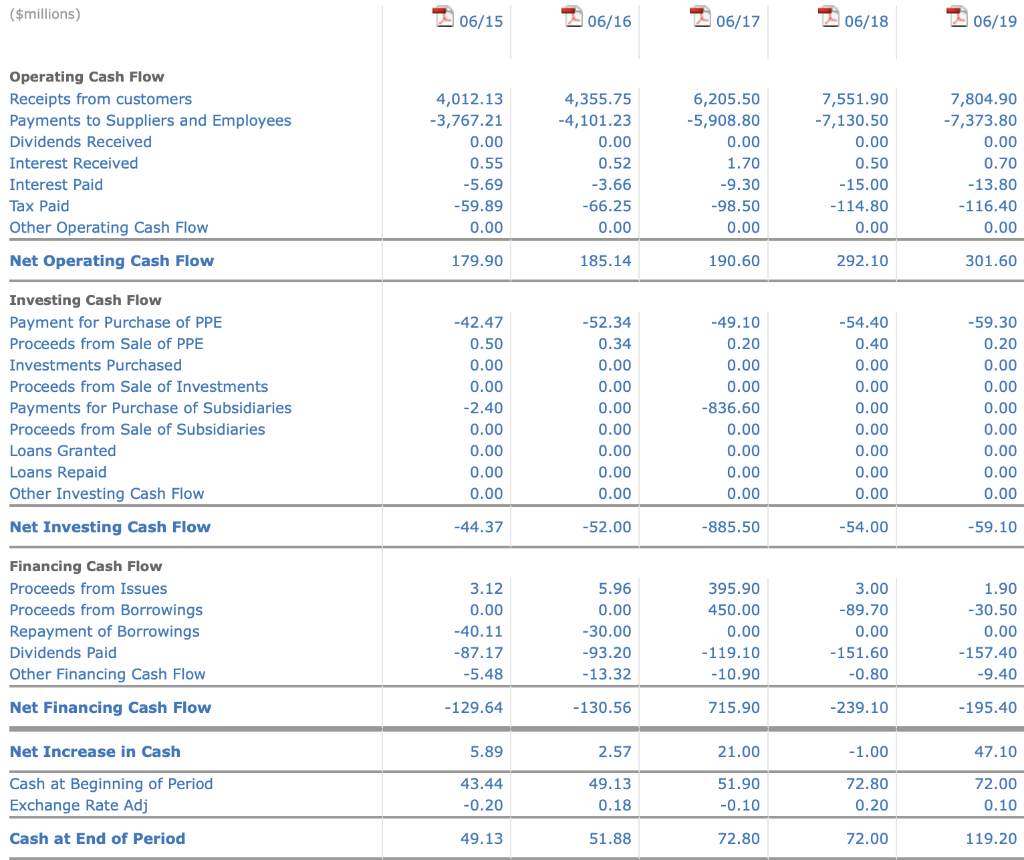
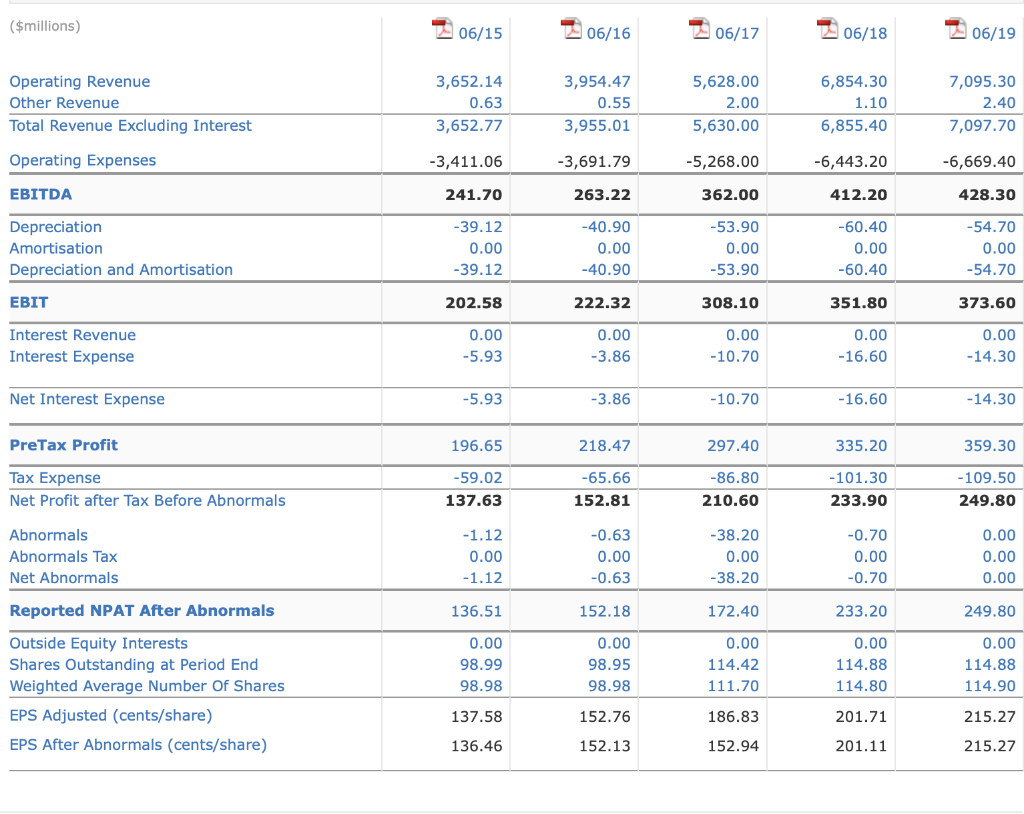
($millions) 2 06/15 206/16 2 06/17 2 06/18 06/19 Operating Cash Flow Receipts from customers Payments to Suppliers and Employees Dividends Received Interest Received Interest Paid Tax Paid Other Operating Cash Flow 4,012.13 -3,767.21 0.00 0.55 -5.69 -59.89 0.00 4,355.75 -4,101.23 0.00 0.52 -3.66 -66.25 0.00 6,205.50 -5,908.80 0.00 1.70 -9.30 -98.50 0.00 7,551.90 -7,130.50 0.00 0.50 -15.00 -114.80 0.00 7,804.90 -7,373.80 0.00 0.70 -13.80 -116.40 0.00 Net Operating Cash Flow 179.90 185.14 190.60 292.10 301.60 -52.34 0.34 0.00 0.00 Investing Cash Flow Payment for Purchase of PPE Proceeds from Sale of PPE Investments Purchased Proceeds from Sale of Investments Payments for Purchase of Subsidiaries Proceeds from Sale of Subsidiaries Loans Granted Loans Repaid Other Investing Cash Flow -42.47 0.50 0.00 0.00 -2.40 0.00 0.00 0.00 0.00 0.00 -49.10 0.20 0.00 0.00 -836.60 0.00 0.00 0.00 0.00 -54.40 0.40 0.00 0.00 0.00 0.00 0.00 0.00 0.00 -59.30 0.20 0.00 0.00 0.00 0.00 0.00 0.00 0.00 0.00 0.00 0.00 0.00 Net Investing Cash Flow -44.37 -52.00 -885.50 -54.00 -59.10 Financing Cash Flow Proceeds from Issues Proceeds from Borrowings Repayment of Borrowings Dividends Paid Other Financing Cash Flow 3.12 0.00 -40.11 -87.17 -5.48 5.96 0.00 -30.00 -93.20 -13.32 395.90 450.00 0.00 -119.10 -10.90 3.00 -89.70 0.00 -151.60 -0.80 1.90 -30.50 0.00 -157.40 -9.40 Net Financing Cash Flow - 129.64 -130.56 715.90 -239.10 -195.40 Net Increase in Cash 5.89 2.57 21.00 -1.00 47.10 Cash at Beginning of Period Exchange Rate Adj 43.44 -0.20 49.13 0.18 51.90 -0.10 72.80 0.20 72.00 0.10 Cash at End of Period 49.13 51.88 72.80 72.00 119.20 ($millions) 06/15 06/16 06/17 06/18 06/19 Operating Revenue Other Revenue Total Revenue Excluding Interest 3,652.14 0.63 3,652.77 3,954.47 0.55 3,955.01 5,628.00 2.00 5,630.00 6,854.30 1.10 6,855.40 7,095.30 2.40 7,097.70 Operating Expenses -3,411.06 -3,691.79 -5,268.00 -6,443.20 -6,669.40 EBITDA 241.70 263.22 362.00 412.20 428.30 Depreciation Amortisation Depreciation and Amortisation -39.12 0.00 -39.12 -40.90 0.00 -40.90 -53.90 0.00 -53.90 -60.40 0.00 -60.40 -54.70 0.00 -54.70 EBIT 202.58 222.32 308.10 351.80 373.60 Interest Revenue Interest Expense 0.00 -5.93 0.00 -3.86 0.00 -10.70 0.00 - 16.60 0.00 -14.30 Net Interest Expense -5.93 -3.86 -10.70 -16.60 -14.30 PreTax Profit 196.65 218.47 297.40 335.20 359.30 Tax Expense Net Profit after Tax Before Abnormals -59.02 137.63 -65.66 152.81 -86.80 210.60 -101.30 233.90 -109.50 249.80 Abnormals Abnormals Tax Net Abnormals -1.12 0.00 -1.12 -0.63 0.00 -0.63 -38.20 0.00 -38.20 -0.70 0.00 -0.70 0.00 0.00 0.00 Reported NPAT After Abnormals 136.51 152.18 172.40 233.20 249.80 0.00 98.99 98.98 0.00 98.95 98.98 0.00 114.42 111.70 0.00 114.88 114.80 0.00 114.88 114.90 Outside Equity Interests Shares Outstanding at Period End Weighted Average Number Of Shares EPS Adjusted (cents/share) EPS After Abnormals (cents/share) 137.58 152.76 186.83 201.71 215.27 136.46 152.13 152.94 201.11 215.27