Provide a valuation of Solar City using DCF and one of the additional metrics studied this semester which you believe is most appropriate (Dividend Discount Models, EV/EBITDA, EV/Sales, P/E). Redone. Hopefully this makes more sense. This is all the information I can provide. If it's the paragraph that distracts you, I will rewrite the estimates. Specify what's necessary and what isn't. Please respond as soon as you reasonably can.
Only focus on what's highlighted below:
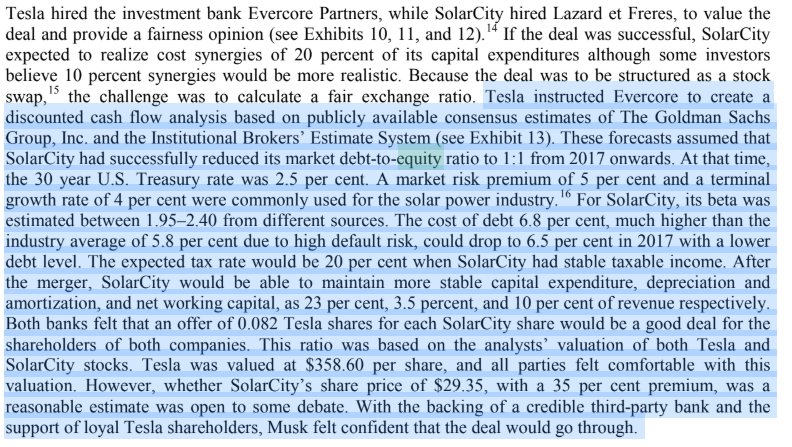
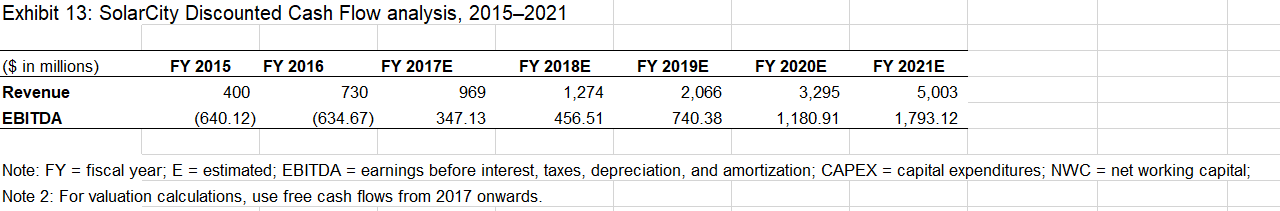
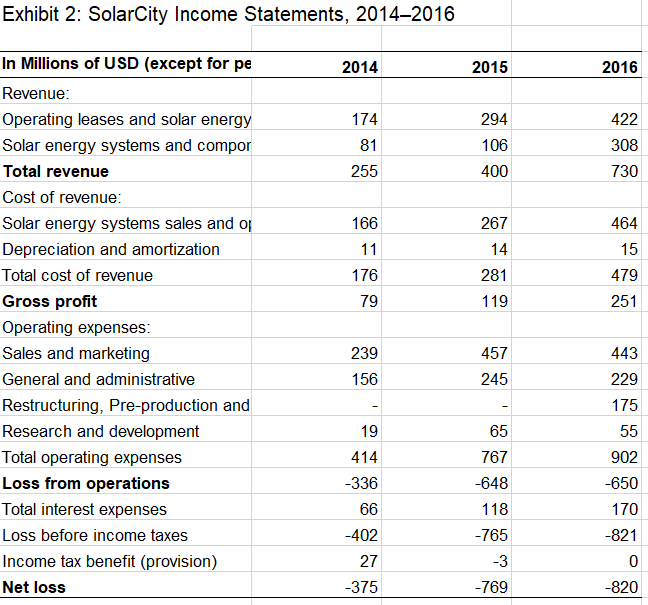
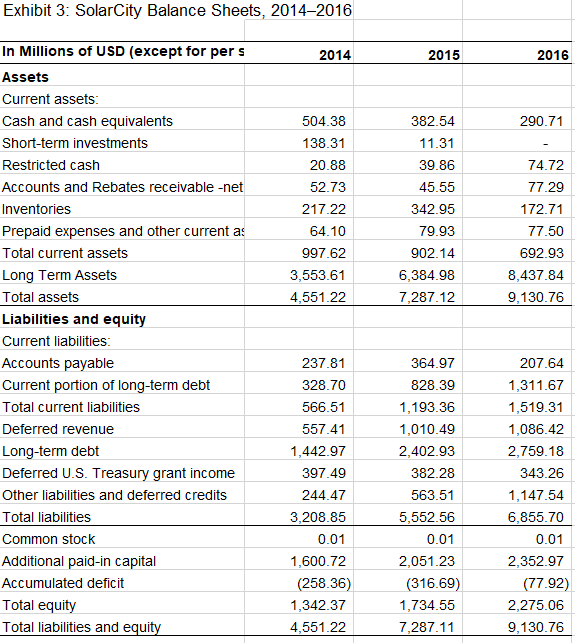
Exhibit 2: SolarCity Income Statements, 2014-2016 In Millions of USD (except for pe 2016 2014 2015 Revenue: Operating leases and solar energy 174 294 422 Solar energy systems and compor 81 106 308 Total revenue 255 400 730 Cost of revenue: Solar energy systems sales and o 166 267 464 Depreciation and amortization 11 14 15 Total cost of revenue 281 479 176 Gross profit 251 79 119 Operating expenses: Sales and marketing 239 457 443 General and administrative 156 245 229 Restructuring, Pre-production and 175 Research and development 19 65 55 Total operating expenses 767 414 902 Loss from operations -336 -648 -650 Total interest expenses 118 66 170 -402 Loss before income taxes -765 -821 Income tax benefit (provision) 27 -3 0 Net loss -375 -769 -820 Exhibit 3: SolarCity Balance Sheets, 2014-2016 2 014 2015 2016 290.71 504.38 138.31 20.88 52.73 217.22 64.10 997.62 3,553.61 4,551.22 382.54 11.31 39.86 45.55 342.95 79.93 902.14 6,384.98 7,287.12 74.72 77.29 172.71 77.50 692.93 8,437.84 9,130.76 In Millions of USD (except for pers Assets Current assets: Cash and cash equivalents Short-term investments Restricted cash Accounts and Rebates receivable -net Inventories Prepaid expenses and other current as Total current assets Long Term Assets Total assets Liabilities and equity Current liabilities: Accounts payable Current portion of long-term debt Total current liabilities Deferred revenue Long-term debt Deferred U.S. Treasury grant income Other liabilities and deferred credits Total liabilities Common stock Additional paid-in capital Accumulated deficit Total equity Total liabilities and equity 237.81 328.70 566.51 557.41 1,442.97 397.49 244.47 3,208.85 0.01 1,600.72 (258.36) 1,342.37 4,551.22 364.97 828.39 1,193.36 1,010.49 2,402.93 382.28 563.51 5,552.56 0.01 2,051.23 (316.69) 1,734.55 7.287.11 207.64 1,311.67 1,519.31 1,086.42 2,759.18 343.26 1,147.54 6,855.70 0.01 2,352.97 (77.92) 2,275.06 9,130.76 Tesla hired the investment bank Evercore Partners, while SolarCity hired Lazard et Freres, to value the deal and provide a fairness opinion (see Exhibits 10, 11, and 12).4 If the deal was successful, SolarCity expected to realize cost synergies of 20 percent of its capital expenditures although some investors believe 10 percent synergies would be more realistic. Because the deal was to be structured as a stock swap,15 the challenge was to calculate a fair exchange ratio. Tesla instructed Evercore_to create a discounted cash flow analysis based on publicly available consensus estimates of The Goldman Sachs Group, Inc. and the Institutional Brokers' Estimate System (see Exhibit 13). These forecasts assumed that SolarCity had successfully reduced its market debt-to-equity ratio to 1:1 from 2017 onwards. At that time the 30 year U.S. Treasury rate was 2.5 per cent. A market risk premium of 5 per cent and a terminal growth rate of 4 per cent were commonly used for the solar power industry. "6 For SolarCity, its beta was estimated between 1.95-2.40 from different sources. The cost of debt 6.8 per cent, much higher than the industry average of 5.8 per cent due to high default risk, could drop to 6.5 per cent in 2017 with a lower debt level. The expected tax rate would be 20 per cent when SolarCity had stable taxable income. After the merger, SolarCity would be able to maintain more stable capital expenditure, depreciation and amortization, and net working capital, as 23 per cent, 3.5 percent, and 10 per cent of revenue respectively Both banks felt that an offer of 0.082 Tesla shares for each SolarCity share would be a good deal for the shareholders of both companies. This ratio was based on the analysts valuation of both Tesla and SolarCity stocks. Tesla was valued at $358.60 per share, and all parties felt comfortable with this valuation. However, whether SolarCity's share price of $29.35, with a 35 per cent premium, was a reasonable estimate was open to some debate. With the backing of a credible third-party bank and the support of loyal Tesla shareholders, Musk felt confident that the deal would go through Exhibit 13: SolarCity Discounted Cash Flow analysis, 2015-2021 ($ in millions) FY 2018E FY 2015 FY 2016 FY 2017E FY 2019E FY 2020E FY 2021E Revenue 1,274 3,295 400 730 969 2,066 5,003 EBITDA (640.12) (634.67) 347.13 456.51 740.38 1,180.91 1,793.12 Note: FY fiscal year, E estimated; EBITDA = earnings before interest, taxes, depreciation, and amortization; CAPEX = capital expenditures, NWC = net working capital; Note 2: For valuation calculations, use free cash flows from 2017 onwards. Exhibit 2: SolarCity Income Statements, 2014-2016 In Millions of USD (except for pe 2016 2014 2015 Revenue: Operating leases and solar energy 174 294 422 Solar energy systems and compor 81 106 308 Total revenue 255 400 730 Cost of revenue: Solar energy systems sales and o 166 267 464 Depreciation and amortization 11 14 15 Total cost of revenue 281 479 176 Gross profit 251 79 119 Operating expenses: Sales and marketing 239 457 443 General and administrative 156 245 229 Restructuring, Pre-production and 175 Research and development 19 65 55 Total operating expenses 767 414 902 Loss from operations -336 -648 -650 Total interest expenses 118 66 170 -402 Loss before income taxes -765 -821 Income tax benefit (provision) 27 -3 0 Net loss -375 -769 -820 Exhibit 3: SolarCity Balance Sheets, 2014-2016 2 014 2015 2016 290.71 504.38 138.31 20.88 52.73 217.22 64.10 997.62 3,553.61 4,551.22 382.54 11.31 39.86 45.55 342.95 79.93 902.14 6,384.98 7,287.12 74.72 77.29 172.71 77.50 692.93 8,437.84 9,130.76 In Millions of USD (except for pers Assets Current assets: Cash and cash equivalents Short-term investments Restricted cash Accounts and Rebates receivable -net Inventories Prepaid expenses and other current as Total current assets Long Term Assets Total assets Liabilities and equity Current liabilities: Accounts payable Current portion of long-term debt Total current liabilities Deferred revenue Long-term debt Deferred U.S. Treasury grant income Other liabilities and deferred credits Total liabilities Common stock Additional paid-in capital Accumulated deficit Total equity Total liabilities and equity 237.81 328.70 566.51 557.41 1,442.97 397.49 244.47 3,208.85 0.01 1,600.72 (258.36) 1,342.37 4,551.22 364.97 828.39 1,193.36 1,010.49 2,402.93 382.28 563.51 5,552.56 0.01 2,051.23 (316.69) 1,734.55 7.287.11 207.64 1,311.67 1,519.31 1,086.42 2,759.18 343.26 1,147.54 6,855.70 0.01 2,352.97 (77.92) 2,275.06 9,130.76 Tesla hired the investment bank Evercore Partners, while SolarCity hired Lazard et Freres, to value the deal and provide a fairness opinion (see Exhibits 10, 11, and 12).4 If the deal was successful, SolarCity expected to realize cost synergies of 20 percent of its capital expenditures although some investors believe 10 percent synergies would be more realistic. Because the deal was to be structured as a stock swap,15 the challenge was to calculate a fair exchange ratio. Tesla instructed Evercore_to create a discounted cash flow analysis based on publicly available consensus estimates of The Goldman Sachs Group, Inc. and the Institutional Brokers' Estimate System (see Exhibit 13). These forecasts assumed that SolarCity had successfully reduced its market debt-to-equity ratio to 1:1 from 2017 onwards. At that time the 30 year U.S. Treasury rate was 2.5 per cent. A market risk premium of 5 per cent and a terminal growth rate of 4 per cent were commonly used for the solar power industry. "6 For SolarCity, its beta was estimated between 1.95-2.40 from different sources. The cost of debt 6.8 per cent, much higher than the industry average of 5.8 per cent due to high default risk, could drop to 6.5 per cent in 2017 with a lower debt level. The expected tax rate would be 20 per cent when SolarCity had stable taxable income. After the merger, SolarCity would be able to maintain more stable capital expenditure, depreciation and amortization, and net working capital, as 23 per cent, 3.5 percent, and 10 per cent of revenue respectively Both banks felt that an offer of 0.082 Tesla shares for each SolarCity share would be a good deal for the shareholders of both companies. This ratio was based on the analysts valuation of both Tesla and SolarCity stocks. Tesla was valued at $358.60 per share, and all parties felt comfortable with this valuation. However, whether SolarCity's share price of $29.35, with a 35 per cent premium, was a reasonable estimate was open to some debate. With the backing of a credible third-party bank and the support of loyal Tesla shareholders, Musk felt confident that the deal would go through Exhibit 13: SolarCity Discounted Cash Flow analysis, 2015-2021 ($ in millions) FY 2018E FY 2015 FY 2016 FY 2017E FY 2019E FY 2020E FY 2021E Revenue 1,274 3,295 400 730 969 2,066 5,003 EBITDA (640.12) (634.67) 347.13 456.51 740.38 1,180.91 1,793.12 Note: FY fiscal year, E estimated; EBITDA = earnings before interest, taxes, depreciation, and amortization; CAPEX = capital expenditures, NWC = net working capital; Note 2: For valuation calculations, use free cash flows from 2017 onwards