Answered step by step
Verified Expert Solution
Question
1 Approved Answer
PROVIDE EXPLANATION AND ANSWER THIS QUESTION BELOW HERE IS THE RESULT OF MY CALCUALTIONS HERE IS THE LAB APPARATUS Q: Assuming your ratio R=0, speculate
PROVIDE EXPLANATION AND ANSWER THIS QUESTION BELOW

HERE IS THE RESULT OF MY CALCUALTIONS

HERE IS THE LAB APPARATUS
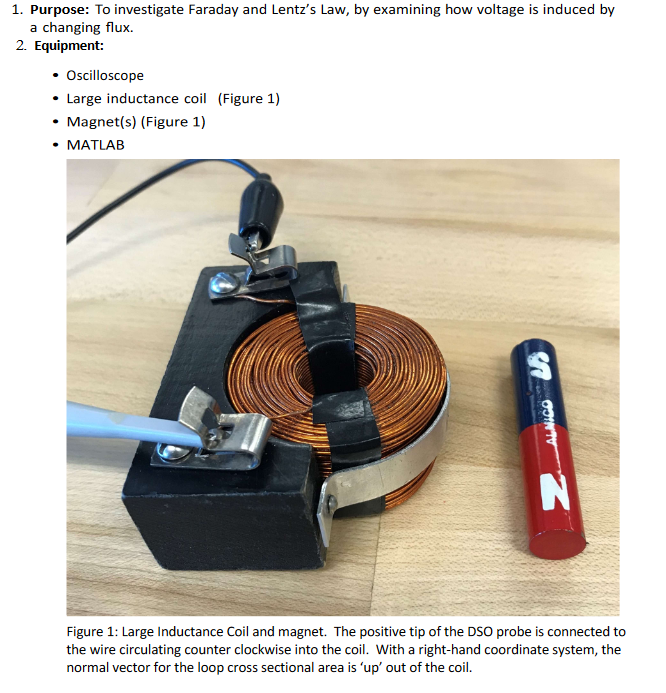
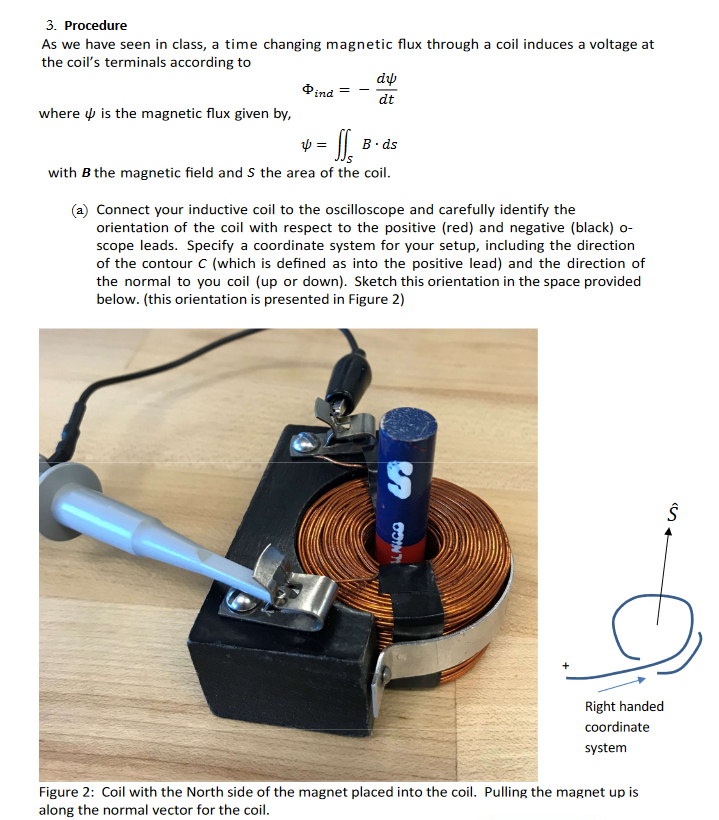


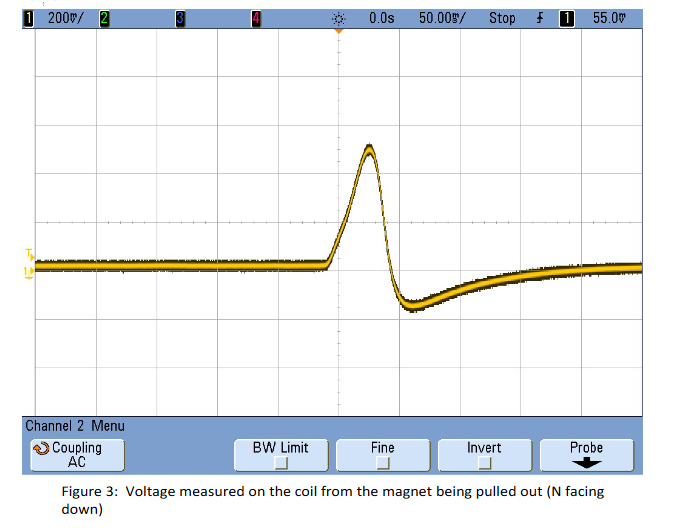
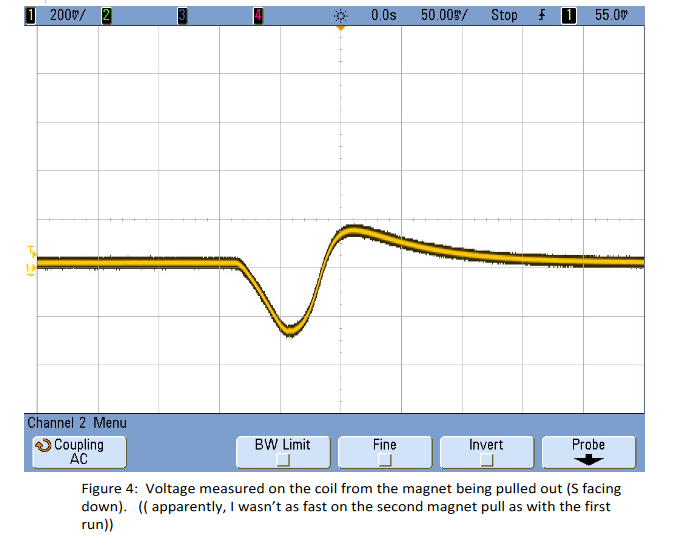
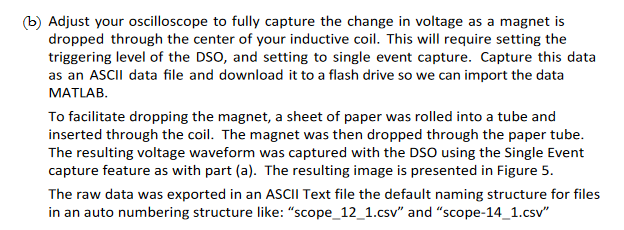
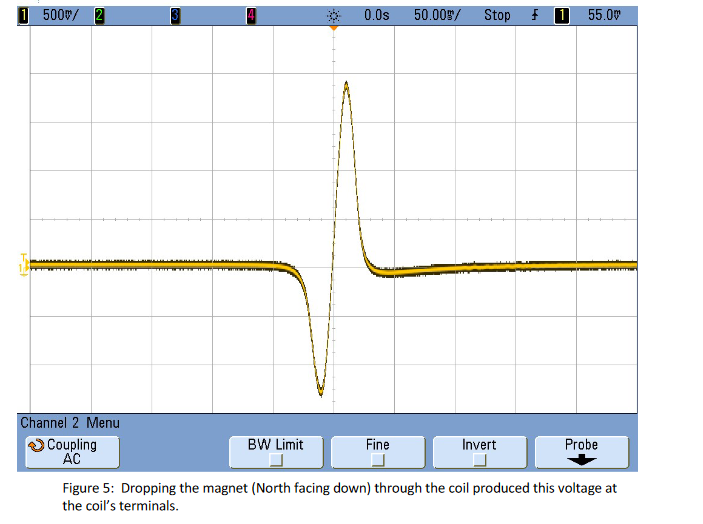
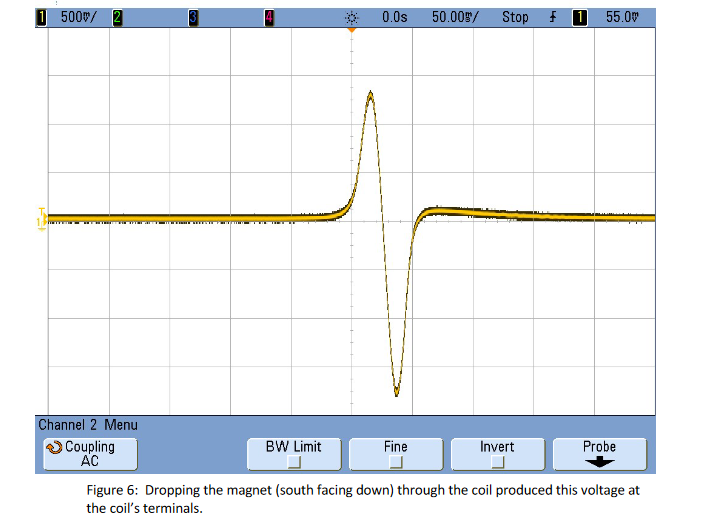
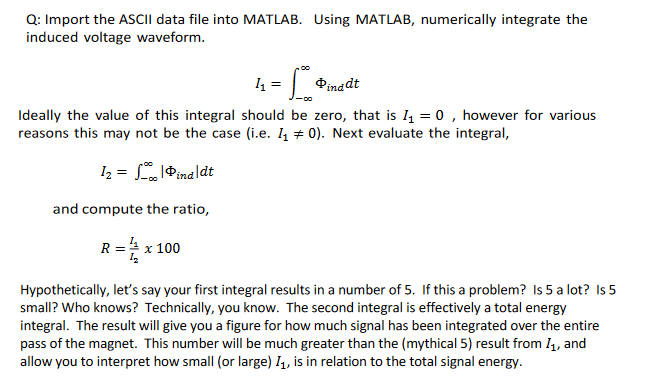
Q: Assuming your ratio R=0, speculate on the reasons for the discrepancy between the theoretical and experimental results. List these below. Is the value of I1 significant? Figure 6: Dropping the magnet (south facing down) through the coil produced this voltage at the coil's terminals. Q: Import the ASCII data file into MATLAB. Using MATLAB, numerically integrate the induced voltage waveform. I1=inddt Ideally the value of this integral should be zero, that is I1=0, however for various reasons this may not be the case (i.e. I1=0 ). Next evaluate the integral, I2=inddt and compute the ratio, R=I2I1100 Hypothetically, let's say your first integral results in a number of 5. If this a problem? Is 5 a lot? Is 5 small? Who knows? Technically, you know. The second integral is effectively a total energy integral. The result will give you a figure for how much signal has been integrated over the entire pass of the magnet. This number will be much greater than the (mythical 5 ) result from I1, and allow you to interpret how small (or large) I1, is in relation to the total signal energy. \begin{tabular}{l|l} 12 & I_1 = cumsum (v)dt; \\ 13 & I_1(end) \\ 14 & \\ 15 & I_2 2 cumsum(abs(v))*dt; \\ 16 & I_2(end) \\ 17 & R = I_1(end) / I_2(end) 100 \\ 18 & ans =8.6250e18 \end{tabular} 1. Purpose: To investigate Faraday and Lentz's Law, by examining how voltage is induced by a changing flux. 2. Equipment: - Oscilloscope - Large inductance coil (Figure 1) - Magnet(s) (Figure 1) - MATLAB Figure 1: Large Inductance Coil and magnet. The positive tip of the DSO probe is connected to the wire circulating counter clockwise into the coil. With a right-hand coordinate system, the normal vector for the loop cross sectional area is 'up' out of the coil. 3. Procedure As we have seen in class, a time changing magnetic flux through a coil induces a voltage at the coil's terminals according to ind=dtd where is the magnetic flux given by, =SBds with B the magnetic field and S the area of the coil. (a) Connect your inductive coil to the oscilloscope and carefully identify the orientation of the coil with respect to the positive (red) and negative (black) oscope leads. Specify a coordinate system for your setup, including the direction of the contour C (which is defined as into the positive lead) and the direction of the normal to you coil (up or down). Sketch this orientation in the space provided below. (this orientation is presented in Figure 2) Figure 2: Coil with the North side of the magnet placed into the coil. Pulling the magnet up is along the normal vector for the coil. Figure 2a: The effective system will be a coil (which will be behaving like a voltage source, with the induced voltage polarity being whatever is necessary to drive current in the direction it needs to go, and the DSO probe, which looks like a large resistor. i. Set the north pole of your magnet within the inductor and remove it rapidly. You'll need to adjust the oscilloscope so that the change in voltage is easily observed. You can use the DSO trigger menu to capture one event to the screen. (This was accomplished by changing the DSO to single capture mode, rather than AUTO, and adjusting the scope trigger to a rising edge with threshold about 100mV. The DSO trace is shown in Figure 3.) Figure 3: Voltage measured on the coil from the magnet being pulled out ( N facing down) down). (( apparently, I wasn't as tast on the second magnet pull as with the trst run)) (b) Adjust your oscilloscope to fully capture the change in voltage as a magnet is dropped through the center of your inductive coil. This will require setting the triggering level of the DSO, and setting to single event capture. Capture this data as an ASCII data file and download it to a flash drive so we can import the data MATLAB. To facilitate dropping the magnet, a sheet of paper was rolled into a tube and inserted through the coil. The magnet was then dropped through the paper tube. The resulting voltage waveform was captured with the DSO using the Single Event capture feature as with part (a). The resulting image is presented in Figure 5. The raw data was exported in an ASCII Text file the default naming structure for files in an auto numbering structure like: "scope_12_1.csv" and "scope-14_1.csv" Figure 5: Dropping the magnet (North facing down) through the coil produced this voltage at the coil's terminals
Step by Step Solution
There are 3 Steps involved in it
Step: 1

Get Instant Access to Expert-Tailored Solutions
See step-by-step solutions with expert insights and AI powered tools for academic success
Step: 2

Step: 3

Ace Your Homework with AI
Get the answers you need in no time with our AI-driven, step-by-step assistance
Get Started


