Answered step by step
Verified Expert Solution
Question
1 Approved Answer
Provide scatter diagram showing the relationship between IT Budget and Organization's Revenue. Create a trend line. Provide labels for X and Y axis Title the
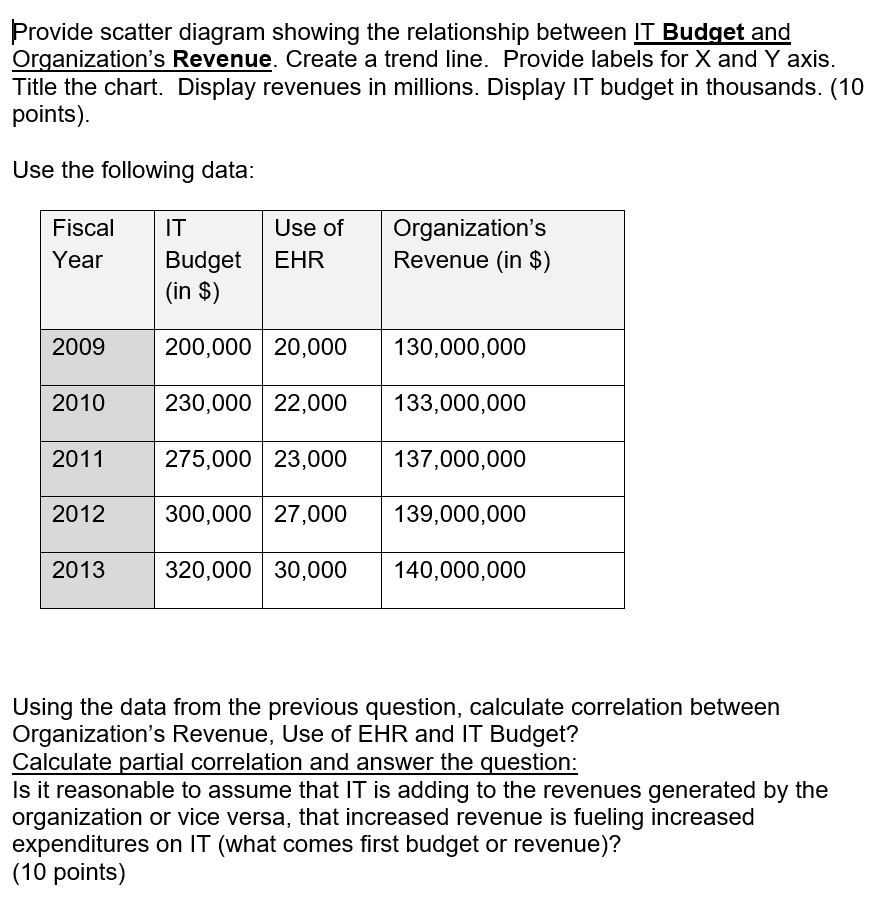
Provide scatter diagram showing the relationship between IT Budget and Organization's Revenue. Create a trend line. Provide labels for X and Y axis Title the chart. Display revenues in millions. Display IT budget in thousands. (10 points) Use the following data: Fiscal Year Use ofOrganization's Revenue (in S) Budget EHR 2009 2010 2011 2012 2013 (in S) 200,00020,000130,000,000 230,00022,000133,000,000 275,00023,000137,000,000 300,00027,000 139,000,000 320,000 30,000140,000,000 Using the data from the previous question, calculate correlation between Organization's Revenue, Use of EHR and IT Budget? Calculate partial correlation and answer the question Is it reasonable to assume that IT is adding to the revenues generated by the organization or vice versa, that increased revenue is fueling increased expenditures on Ii (what comes first budget or revenue)? (10 points)
Step by Step Solution
There are 3 Steps involved in it
Step: 1
Get Instant Access to Expert-Tailored Solutions
See step-by-step solutions with expert insights and AI powered tools for academic success
Step: 2
Step: 3
Ace Your Homework with AI
Get the answers you need in no time with our AI-driven, step-by-step assistance
Get Started