

Answered step by step
Verified Expert Solution
Question
1 Approved Answer
provide the plot!! L01(h,y)={0,1,h=yh=y. As usual, define the risk to be the average loss: R01(h)=n1i=1nL01(h,y) 2 Notice that R01(h) can be interpreted as the misclassification
provide the plot!! 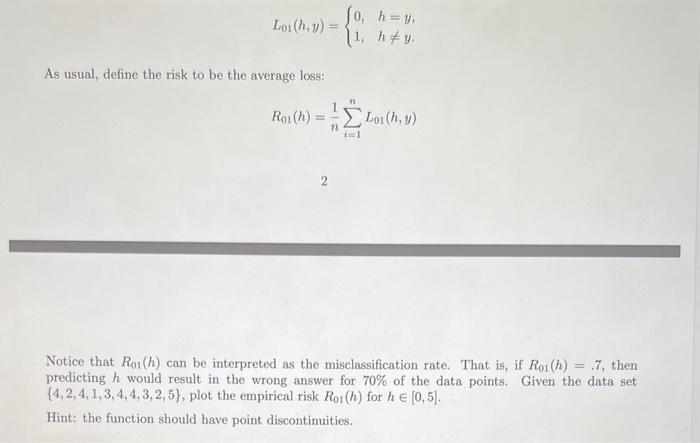
L01(h,y)={0,1,h=yh=y. As usual, define the risk to be the average loss: R01(h)=n1i=1nL01(h,y) 2 Notice that R01(h) can be interpreted as the misclassification rate. That is, if R01(h)=.7, then predicting h would result in the wrong answer for 70% of the data points. Given the data set {4,2,4,1,3,4,4,3,2,5}, plot the empirical risk R01(h) for h[0,5]. Hint: the function should have point discontinuities Step by Step Solution
There are 3 Steps involved in it
Step: 1

Get Instant Access to Expert-Tailored Solutions
See step-by-step solutions with expert insights and AI powered tools for academic success
Step: 2

Step: 3
Ace Your Homework with AI
Get the answers you need in no time with our AI-driven, step-by-step assistance
Get Started
Samsung Galaxy S23 Ultra Comprehensive User Manual
Authors: Leo Scott
1st Edition
B0BVPBJK5Q, 979-8377286455