

Question
Provide the summary statistic as well as histograms for the variables balance and income for the whole dataset. Explain some of the key characteristics of
Provide the summary statistic as well as histograms for the variables balance and income for the whole dataset. Explain some of the key characteristics of the dataset.
Using conditional statements on the variables default and student, provide the summary statistics (as well as histograms) for the variables balance and income for the different combinations of groups. That is, (1) default = Yes and student = Yes; (2) default = Yes, student = No; (3) default = No, student = Yes; and (4) default = No, student =No. Explain some of the key characteristics of the dataset.
Using the variable default as the response variable, fit a decision tree model with the predictor variables student, balance, and income. Comment on the output. Which variable(s) is significant? How good is the model prediction?
Lets assume a credit card applicant is a student with a balance of $2000 and an income of $1850. How likely will he/she default according to the fitted decision tree model? Explain based on the SAS output.
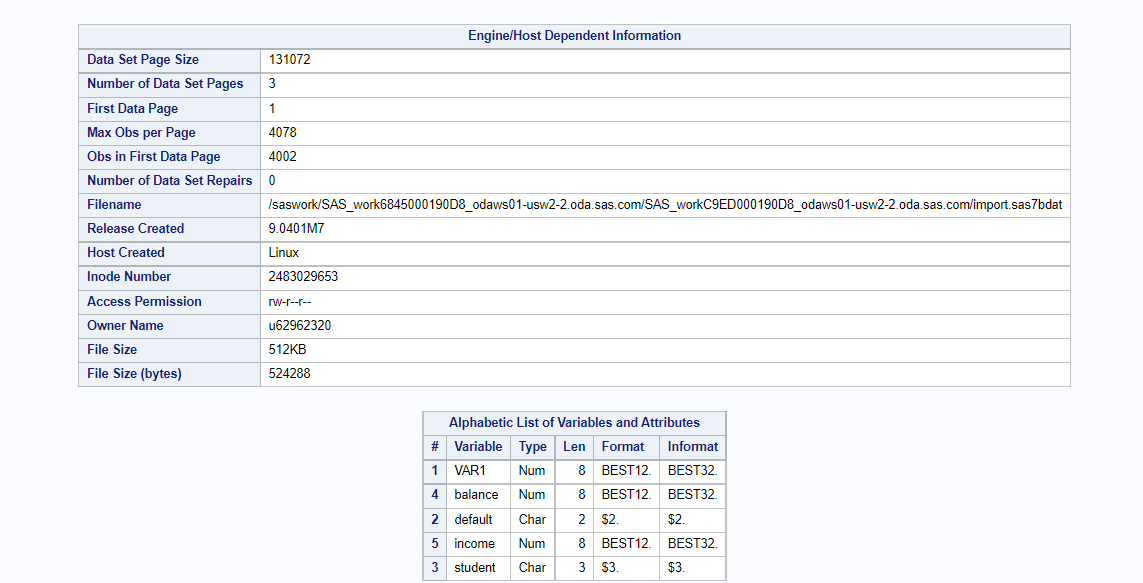
\begin{tabular}{|l|l|} \hline \multicolumn{2}{l}{} \\ \hline Data Set Page Size & 131072 \\ \hline Number of Data Set Pages & 3 \\ \hline First Data Page & 1 \\ \hline Max Obs per Page & 4078 \\ \hline Obs in First Data Page & 4002 \\ \hline Number of Data Set Repairs & 0 \\ \hline Filename & /saswork/SAS_work6845000190D8_odaws01-usw2-2.oda.sas.com/SAS_workC9ED000190D8_odaws01-usw2-2.oda.sas.com/import.sas7bdat \\ \hline Release Created & 9.0401M7 \\ \hline Host Created & Linux \\ \hline Inode Number & 2483029653 \\ \hline Access Permission & rw-r-r-- \\ \hline Owner Name & u62962320 \\ \hline File Size & 512KB \\ \hline File Size (bytes) & 524288 \\ \hline \end{tabular} \begin{tabular}{|l|l|l|r|l|l|} \hline \multicolumn{5}{|c|}{ Alphabetic List of Variables and Attributes } \\ \hline \# & Variable & Type & Len & Format & Informat \\ \hline 1 & VAR1 & Num & 8 & BEST12. & BEST32. \\ \hline 4 & balance & Num & 8 & BEST12. & BEST32. \\ \hline 2 & default & Char & 2 & $2. & $2. \\ \hline 5 & income & Num & 8 & BEST12. & BEST32. \\ \hline 3 & student & Char & 3 & $3. & $3. \\ \hline \end{tabular}Step by Step Solution
There are 3 Steps involved in it
Step: 1

Get Instant Access to Expert-Tailored Solutions
See step-by-step solutions with expert insights and AI powered tools for academic success
Step: 2

Step: 3
Ace Your Homework with AI
Get the answers you need in no time with our AI-driven, step-by-step assistance
Get Started
Database Systems For Advanced Applications Dasfax 2009 International Workshops Benchmark Mcis Wdpp Ppda Mbc Phd Brisbane Australia April 2009 Lncs 5667
Authors: Lei Chen ,Chengfei Liu ,Qing Liu ,Ke Deng
2009th Edition
364204204X, 978-3642042041