Question
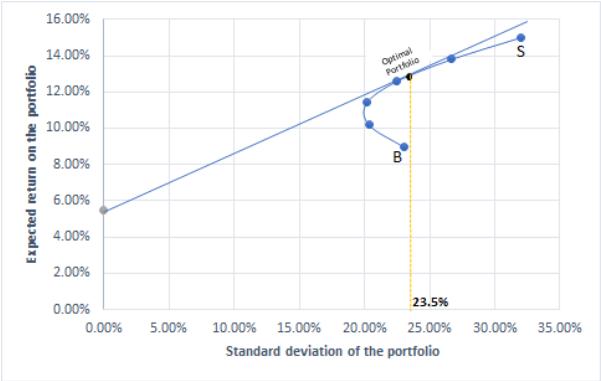
Provide your personal descriptions by looking below figures: Stock fund (S) Bond fund (B) Risk - free return: Ws 0% 20% 40% 60% 80% 100%


Stock fund (S) Bond fund (B) Risk - free return: Ws 0% 20% 40% 60% 80% 100% Expected Standard Return 15% 9% 1- Ws 100% 80% 60% 40% 20% 0% Deviation Correlation 32% 23% 5.50% Expected return on the portfolio 9.00% 10.20% 11.40% 12.60% 13.80% 15.00% 0.15 Standard deviation of the portfolio 23.00% 20.37% 20.18% 22.50% 26.68% 32.00% Expected return on the portfolio 16.00% 14.00% 12.00% 10.00% 8.00% 6.00% 4.00% 2.00% 0.00% 0.00% 5.00% Portfolio frontier B 10.00% 15.00% 20.00% 25.00% Standard deviation of the portfolio 30.00% S 35.00%
Step by Step Solution
3.46 Rating (153 Votes )
There are 3 Steps involved in it
Step: 1
The table provided represents the expected return and standard deviation for a portfolio consisting ...
Get Instant Access to Expert-Tailored Solutions
See step-by-step solutions with expert insights and AI powered tools for academic success
Step: 2

Step: 3

Ace Your Homework with AI
Get the answers you need in no time with our AI-driven, step-by-step assistance
Get StartedRecommended Textbook for
Income Tax Fundamentals 2013
Authors: Gerald E. Whittenburg, Martha Altus Buller, Steven L Gill
31st Edition
1111972516, 978-1285586618, 1285586611, 978-1285613109, 978-1111972516
Students also viewed these Finance questions
Question
Answered: 1 week ago
Question
Answered: 1 week ago
Question
Answered: 1 week ago
Question
Answered: 1 week ago
Question
Answered: 1 week ago
Question
Answered: 1 week ago
Question
Answered: 1 week ago
Question
Answered: 1 week ago
Question
Answered: 1 week ago
Question
Answered: 1 week ago
Question
Answered: 1 week ago
Question
Answered: 1 week ago
Question
Answered: 1 week ago
Question
Answered: 1 week ago
Question
Answered: 1 week ago
Question
Answered: 1 week ago
Question
Answered: 1 week ago
Question
Answered: 1 week ago
Question
Answered: 1 week ago
Question
Answered: 1 week ago
Question
Answered: 1 week ago
Question
Answered: 1 week ago
View Answer in SolutionInn App


