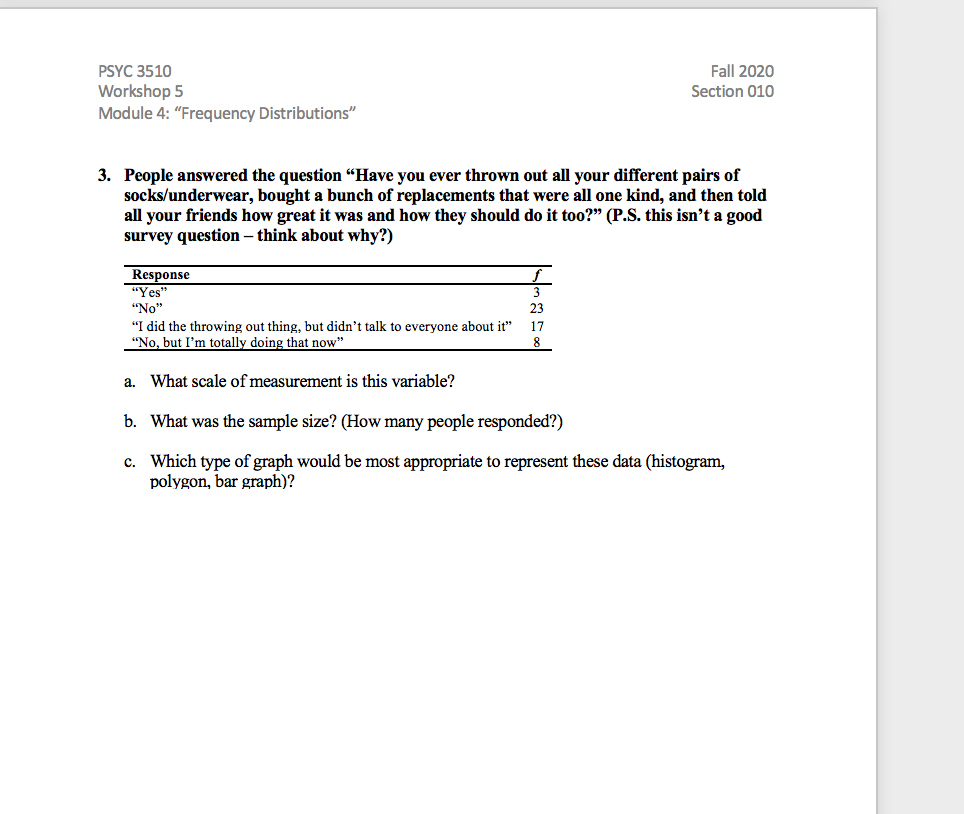
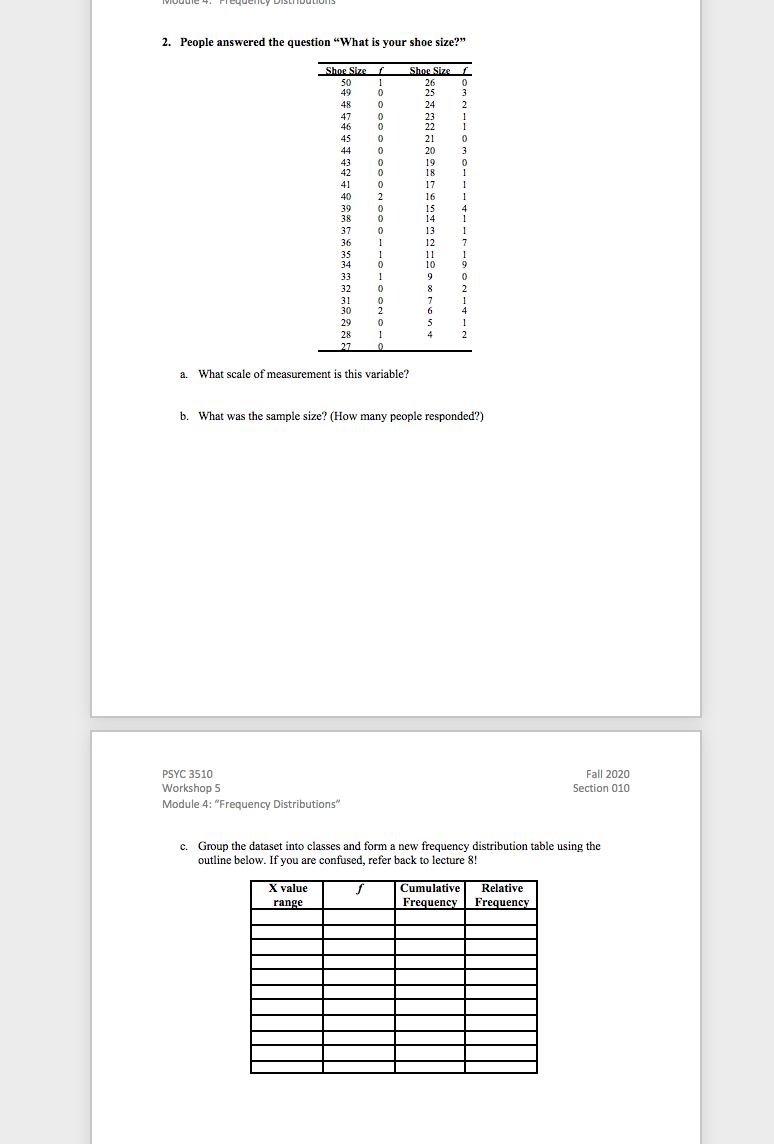
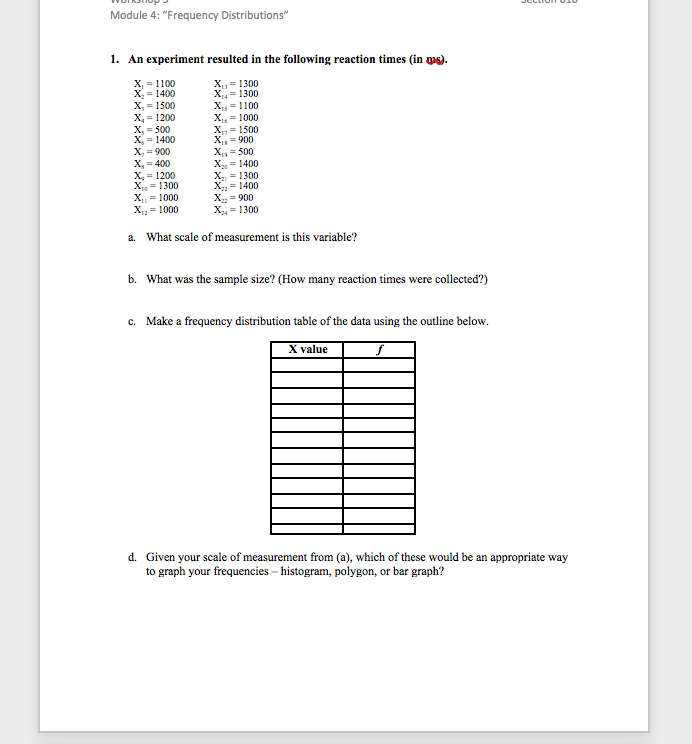
PSYC 3510 Fall 2020 Workshop 5 Section 010 Module 4: "Frequency Distributions" 3. People answered the question "Have you ever thrown out all your different pairs of socks/underwear, bought a bunch of replacements that were all one kind, and then told all your friends how great it was and how they should do it too?" (P.S. this isn't a good survey question - think about why?) Response "Yes "No" 23 "I did the throwing out thing, but didn't talk to everyone about it" 17 "No, but I'm totally doing that now" a. What scale of measurement is this variable? b. What was the sample size? (How many people responded?) c. Which type of graph would be most appropriate to represent these data (histogram, polygon, bar graph)?2. People answered the question "What is your shoe size?" Shoe Size f Shoe Size 50 -Owa--NWO N-A-NO0-4--A- a. What scale of measurement is this variable? b. What was the sample size? (How many people responded?) PSYC 3510 Fall 2020 Workshop 5 Section 010 Module 4: "Frequency Distributions" c. Group the dataset into classes and form a new frequency distribution table using the outline below. If you are confused, refer back to lecture 8! X value Cumulative Relative range Frequency FrequencyModule 4: "Frequency Distributions" 1. An experiment resulted in the following reaction times (in ors). X, = 1100 X, = 1400 X = 1300 X = 1300 X, = 1500 Xy = 1100 X, = 1200 X = 1000 X, = 500 X. = 1400 X17 = 1500 Xis =900 X, = 900 X, = 400 XIs =500 X, = 1200 X20 = 1400 X= 1300 X, = 1300 X2: = 1400 X = 1000 X, = 900 X12 = 1000 Xy = 1300 What scale of measurement is this variable? b. What was the sample size? (How many reaction times were collected?) c. Make a frequency distribution table of the data using the outline below. & value d. Given your scale of measurement from (a), which of these would be an appropriate way to graph your frequencies - histogram, polygon, or bar graph