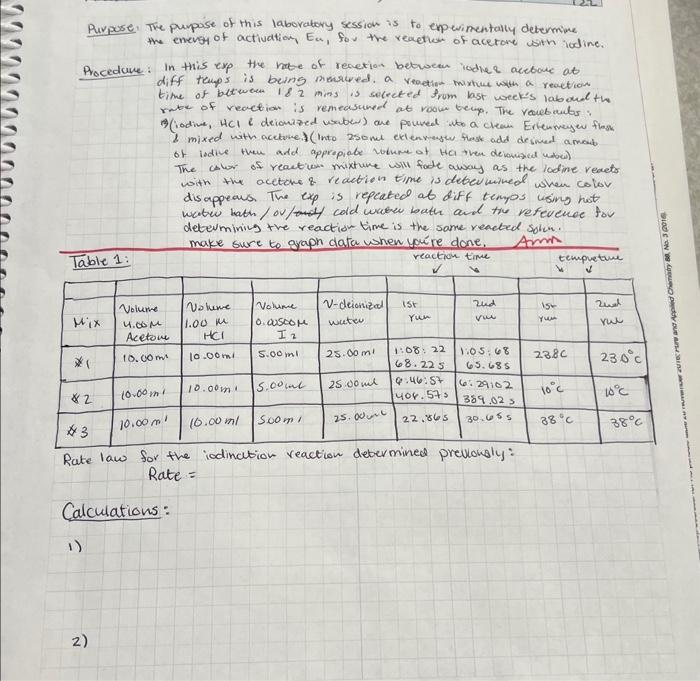
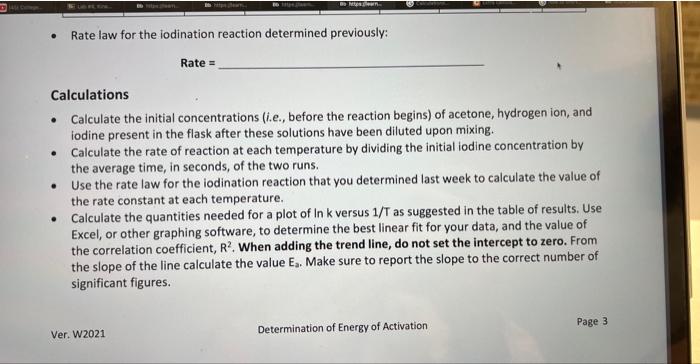
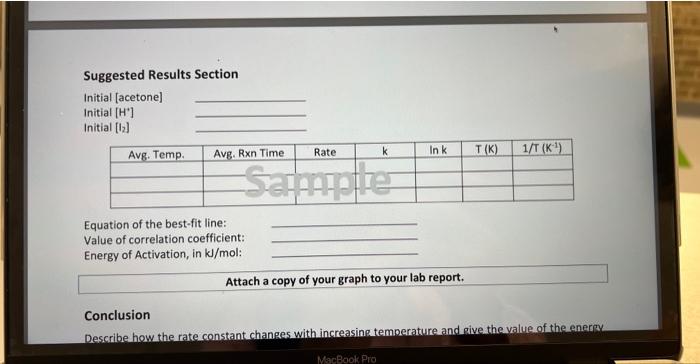
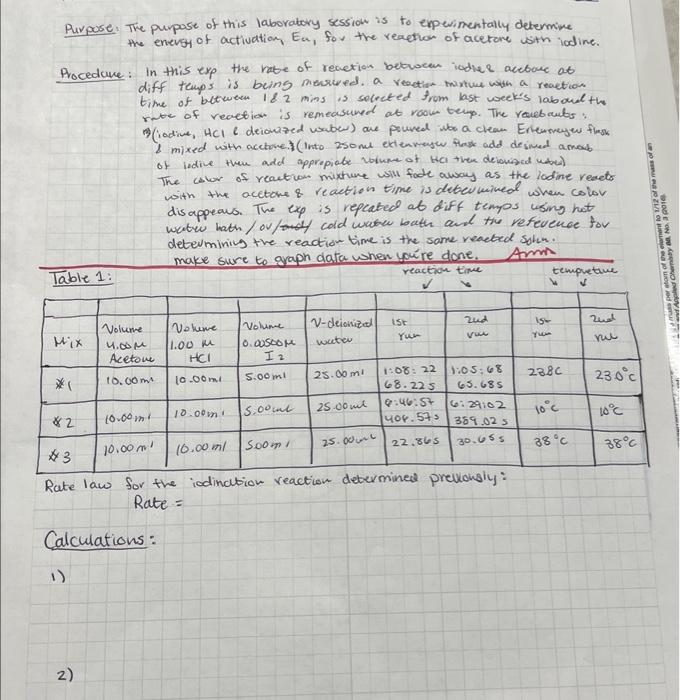
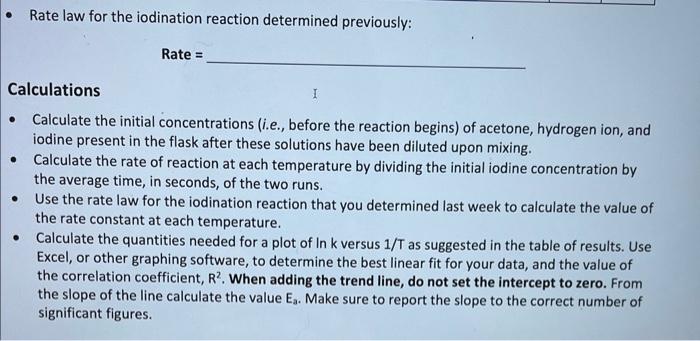
Purpore. The puppose of this laboratory session is to enpevimentally determine the enevs of actiuation, Ea, fou the reaetion of acetore with iodine. Procedure: In this exp the re of revetion betwoen iodlee acebore at diff teups is being mewreded. a veaetion- mixture with a reaction time of between is 2 mins is secected from last week's laboud th rute of reaction is remeasuned at room tern. The roubculs: 8 mixed with accetve) (Into 250met etlenvensw thesk add desmed amoub. of lidile then add appropiabe volume of tha then devonsad unber) The calor of reaction mixture will fade away as the lodine reacts with the acetone \& reaction time is deten mined when colov disappeaus. The exp is repeated at diff tempos using hot wabw bath/ou/f cold wreren bath and tiv refevenoe for determminin the reaction time is the same reacted solu. make sure to graph data when yore done. Amm Rate law for the iodination reaction debermined previongly: Rate = Calculations: - Rate law for the iodination reaction determined previously: Rate = Calculations - Calculate the initial concentrations (i.e., before the reaction begins) of acetone, hydrogen ion, and iodine present in the flask after these solutions have been diluted upon mixing. - Calculate the rate of reaction at each temperature by dividing the initial iodine concentration by the average time, in seconds, of the two runs. - Use the rate law for the iodination reaction that you determined last week to calculate the value of the rate constant at each temperature. - Calculate the quantities needed for a plot of lnk versus 1/T as suggested in the table of results. Use Excel, or other graphing software, to determine the best linear fit for your data, and the value of the correlation coefficient, R2. When adding the trend line, do not set the intercept to zero. From the slope of the line calculate the value E2. Make sure to report the slope to the correct number of significant figures. Suggested Results Section Initial [acetone] Initial [ H+] Initial [b2] Equation of the best-fit line: Value of correlation coefficient: Energy of Activation, in kJ/mol : Attach a copy of your graph to your lab report. Conclusion Describe how the rate constant changes with increasing temperature and aive the value of the energy Purpose. The purpase of this laborabory session is to experimentally determine the enevgy of activation, Ea, for the reaption of acetore with lodine. Procedure: In this exp the rabe of renetion between iodlee acetare at diff temps is being miecreded. a rectige twixtue with a reaction time of between 182 mins is solreted from last week's laboud the retse of reaction is remeasured at rook tenp. The reubruts: D)(iadive, HCll deionazed vaber) are poured ibo a clean Erlensenew flesk i mixed with acctove.) (into 250me exteavash Hrosk add desined amoub. of ledine then add appripiabe volume of HCI then delonised udred) The calor of reaction mixhure will fode away as the lodine resets with the acetoke \& reaction time is detenkined when color dis appeaus. The exp is repcated at diff tempos using hot watre kath / ov/s cold when bath and the vefevence tor determining the reaction time is the some reacted solin. Rate law for the iodination reaction debermine prevonsiy: Rate = Calculations: Rate law for the iodination reaction determined previously: Rate = Calculations - Calculate the initial concentrations (i.e., before the reaction begins) of acetone, hydrogen ion, and iodine present in the flask after these solutions have been diluted upon mixing. - Calculate the rate of reaction at each temperature by dividing the initial iodine concentration by the average time, in seconds, of the two runs. - Use the rate law for the iodination reaction that you determined last week to calculate the value of the rate constant at each temperature. - Calculate the quantities needed for a plot of In k versus 1/T as suggested in the table of results. Use Excel, or other graphing software, to determine the best linear fit for your data, and the value of the correlation coefficient, R2. When adding the trend line, do not set the intercept to zero. From the slope of the line calculate the value Ea. Make sure to report the slope to the correct number of significant figures. Purpore. The puppose of this laboratory session is to enpevimentally determine the enevs of actiuation, Ea, fou the reaetion of acetore with iodine. Procedure: In this exp the re of revetion betwoen iodlee acebore at diff teups is being mewreded. a veaetion- mixture with a reaction time of between is 2 mins is secected from last week's laboud th rute of reaction is remeasuned at room tern. The roubculs: 8 mixed with accetve) (Into 250met etlenvensw thesk add desmed amoub. of lidile then add appropiabe volume of tha then devonsad unber) The calor of reaction mixture will fade away as the lodine reacts with the acetone \& reaction time is deten mined when colov disappeaus. The exp is repeated at diff tempos using hot wabw bath/ou/f cold wreren bath and tiv refevenoe for determminin the reaction time is the same reacted solu. make sure to graph data when yore done. Amm Rate law for the iodination reaction debermined previongly: Rate = Calculations: - Rate law for the iodination reaction determined previously: Rate = Calculations - Calculate the initial concentrations (i.e., before the reaction begins) of acetone, hydrogen ion, and iodine present in the flask after these solutions have been diluted upon mixing. - Calculate the rate of reaction at each temperature by dividing the initial iodine concentration by the average time, in seconds, of the two runs. - Use the rate law for the iodination reaction that you determined last week to calculate the value of the rate constant at each temperature. - Calculate the quantities needed for a plot of lnk versus 1/T as suggested in the table of results. Use Excel, or other graphing software, to determine the best linear fit for your data, and the value of the correlation coefficient, R2. When adding the trend line, do not set the intercept to zero. From the slope of the line calculate the value E2. Make sure to report the slope to the correct number of significant figures. Suggested Results Section Initial [acetone] Initial [ H+] Initial [b2] Equation of the best-fit line: Value of correlation coefficient: Energy of Activation, in kJ/mol : Attach a copy of your graph to your lab report. Conclusion Describe how the rate constant changes with increasing temperature and aive the value of the energy Purpose. The purpase of this laborabory session is to experimentally determine the enevgy of activation, Ea, for the reaption of acetore with lodine. Procedure: In this exp the rabe of renetion between iodlee acetare at diff temps is being miecreded. a rectige twixtue with a reaction time of between 182 mins is solreted from last week's laboud the retse of reaction is remeasured at rook tenp. The reubruts: D)(iadive, HCll deionazed vaber) are poured ibo a clean Erlensenew flesk i mixed with acctove.) (into 250me exteavash Hrosk add desined amoub. of ledine then add appripiabe volume of HCI then delonised udred) The calor of reaction mixhure will fode away as the lodine resets with the acetoke \& reaction time is detenkined when color dis appeaus. The exp is repcated at diff tempos using hot watre kath / ov/s cold when bath and the vefevence tor determining the reaction time is the some reacted solin. Rate law for the iodination reaction debermine prevonsiy: Rate = Calculations: Rate law for the iodination reaction determined previously: Rate = Calculations - Calculate the initial concentrations (i.e., before the reaction begins) of acetone, hydrogen ion, and iodine present in the flask after these solutions have been diluted upon mixing. - Calculate the rate of reaction at each temperature by dividing the initial iodine concentration by the average time, in seconds, of the two runs. - Use the rate law for the iodination reaction that you determined last week to calculate the value of the rate constant at each temperature. - Calculate the quantities needed for a plot of In k versus 1/T as suggested in the table of results. Use Excel, or other graphing software, to determine the best linear fit for your data, and the value of the correlation coefficient, R2. When adding the trend line, do not set the intercept to zero. From the slope of the line calculate the value Ea. Make sure to report the slope to the correct number of significant figures
