Answered step by step
Verified Expert Solution
Link Copied!

Question

1 Approved Answer

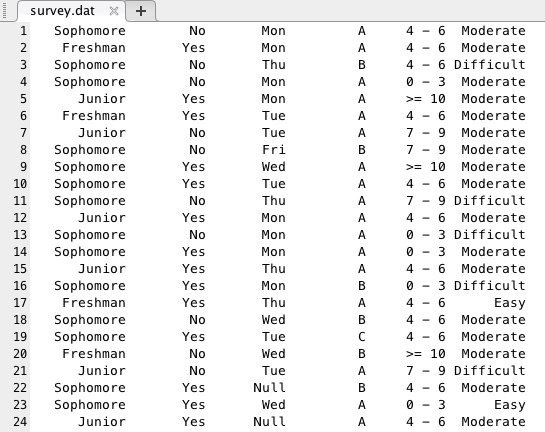
Put answers in a MATLAB script ose e itp The file Problen 1: Download the file survey.dat E contains data collected in the survey which

Put answers in a MATLAB script

image text in transcribed

image text in transcribed

ose e itp The file Problen 1: Download the file survey.dat E contains data collected in the survey which you had taken during homework 4. The following 6 questions were asked in the survey 1. What is your class level? 2. Do you have any MATLAB/coding experience prior to the course? 3. Which of the following lab sessions do you attend most frequently? What grade do you expect for the course? 5. On average how many hours per week do you spend studying outside of class? 6. How difficult were the homework? The data file has 6 columns which contain the answers to the questions above. Note that, when students did not answer the question, the collected data is a string 'Null'. Load the data into MATLAB, and perform the following exercises: (a) Make a bar graph to show the number of students who frequently attend the Monday Tuesday, Wednesday, Thursday and Friday lab sessions. Label the axes and give title. Set pla = 'See figure 1' plb. answer into plc. swer into pld. (b) How many students have previous MATLAB/coding experience? Put the answer into cHow many students spend more than 6 hours studying outside of class? Put the d) How many sophomores think the homework assignments were difficult? Put the an- ose e itp The file Problen 1: Download the file survey.dat E contains data collected in the survey which you had taken during homework 4. The following 6 questions were asked in the survey 1. What is your class level? 2. Do you have any MATLAB/coding experience prior to the course? 3. Which of the following lab sessions do you attend most frequently? What grade do you expect for the course? 5. On average how many hours per week do you spend studying outside of class? 6. How difficult were the homework? The data file has 6 columns which contain the answers to the questions above. Note that, when students did not answer the question, the collected data is a string 'Null'. Load the data into MATLAB, and perform the following exercises: (a) Make a bar graph to show the number of students who frequently attend the Monday Tuesday, Wednesday, Thursday and Friday lab sessions. Label the axes and give title. Set pla = 'See figure 1' plb. answer into plc. swer into pld. (b) How many students have previous MATLAB/coding experience? Put the answer into cHow many students spend more than 6 hours studying outside of class? Put the d) How many sophomores think the homework assignments were difficult? Put the an

Step by Step Solution

There are 3 Steps involved in it

Step: 1

blur-text-image

Get Instant Access to Expert-Tailored Solutions

See step-by-step solutions with expert insights and AI powered tools for academic success

Step: 2

blur-text-image

Step: 3

blur-text-image

Ace Your Homework with AI

Get the answers you need in no time with our AI-driven, step-by-step assistance

Get Started

Recommended Textbook for

Database Design Application Development And Administration

Authors: Michael V. Mannino

3rd Edition

0071107010, 978-0071107013

More Books

Students also viewed these Databases questions

Question

64 Incident and emergency response plans.

Answered: 1 week ago