Put the following items in an excel spreadsheet with annotated formulas and explanations (Managerial Accounting)
Three Part Analysis
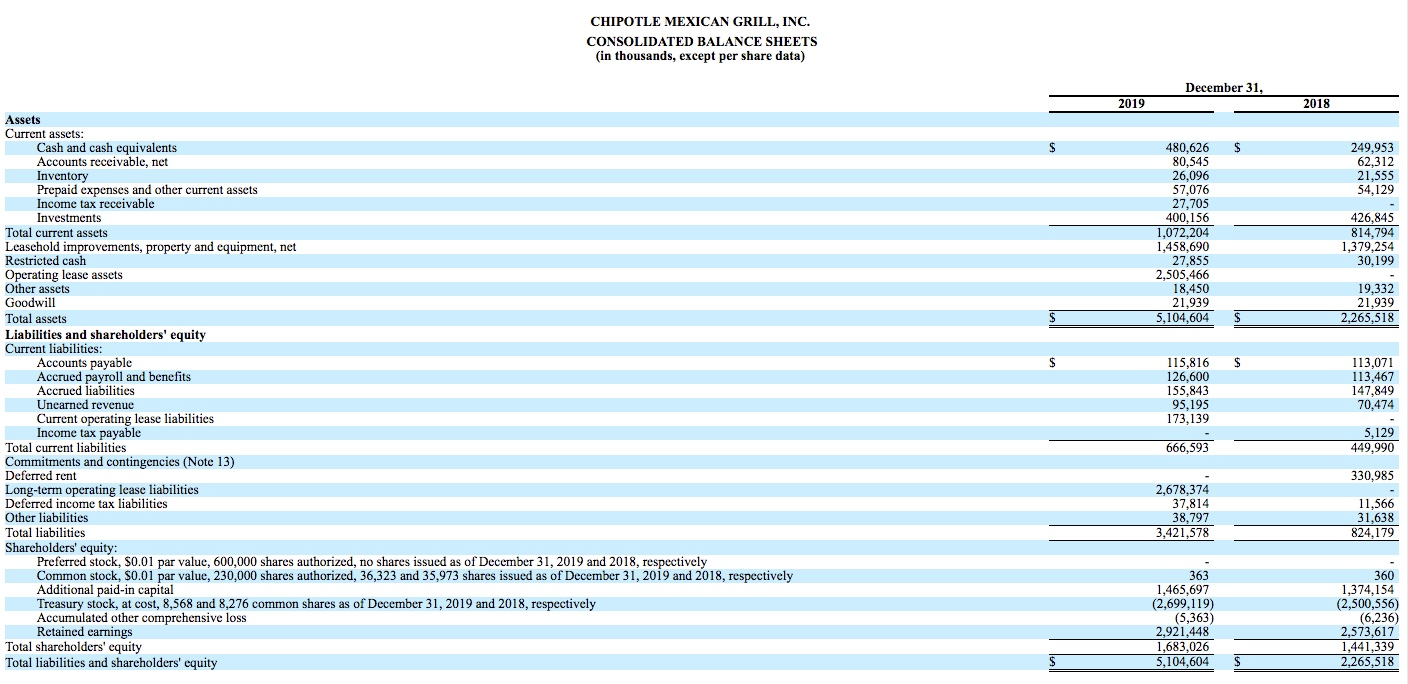
Part 1: Provide common-size analysis of this companys income statement and balance sheet for the two most recent years (must be done using Excel with formulas).
Part 2: Provide horizontal analysis of this companys income statement and balance sheet, showing the dollar amount and percent of change using the two most recent years (you must use an Excel spreadsheet with formulas).
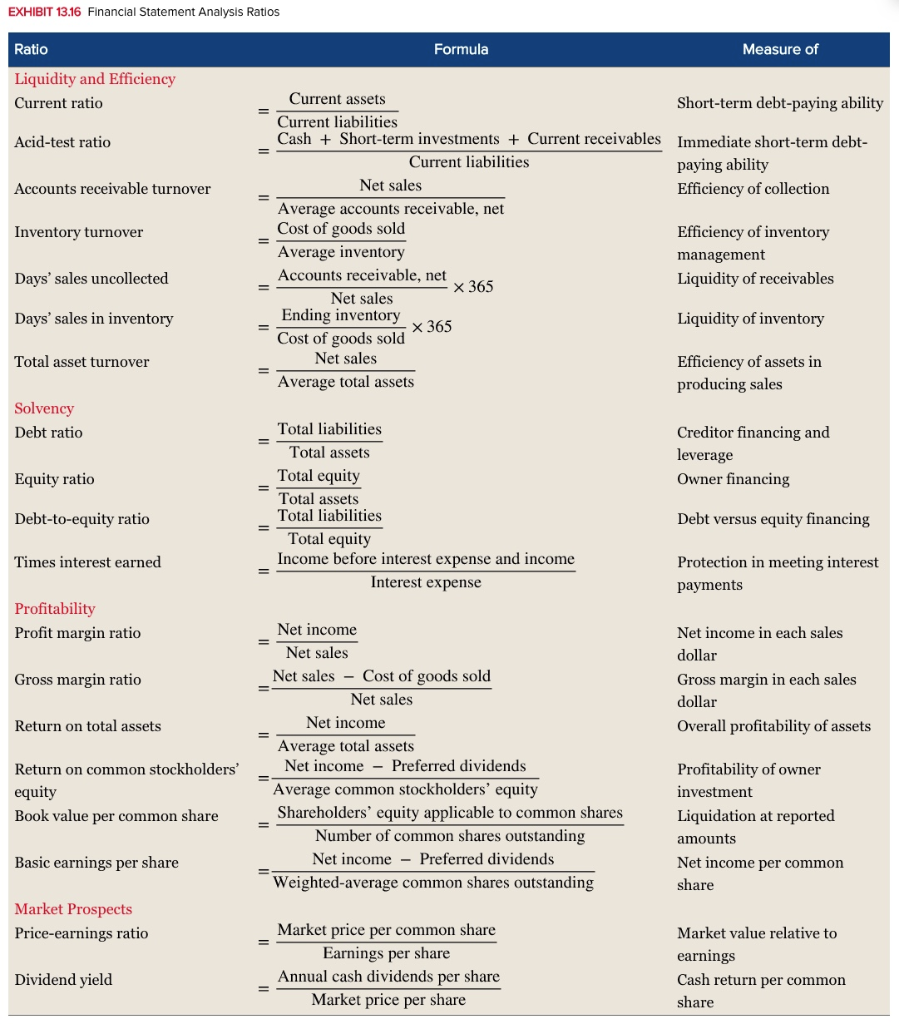
Part 3: Perform ratio analysis on this company using the ratios listed in Exhibit 13.16 on page 505 of your text (these must be in an Excel spreadsheet, using formulas to calculate the ratios). You should present them in a similar format as the text: group by category, list name of ratio, the formula in words, and the ratio calculation. Give a short explanation of your conclusions about your company after each category of ratios (i.e. How liquid is your company? How efficiently is it using its assets? etc.).
Income Statement 2018/2019: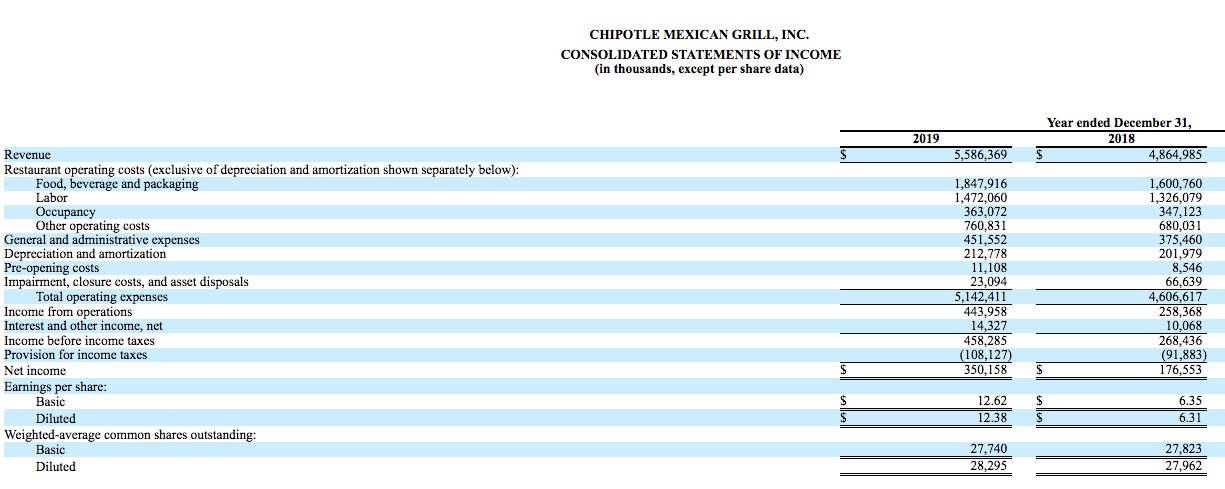
Balance Sheet 2018/2019:
Ratio Analysis
CHIPOTLE MEXICAN GRILL, INC. CONSOLIDATED STATEMENTS OF INCOME (in thousands, except per share data) Year ended December 31, 2018 2019 5,586,369 4,864,985 Revenue Restaurant operating costs (exclusive of depreciation and amortization shown separately below): Food, beverage and packaging Labor Occupancy Other operating costs General and administrative expenses Depreciation and amortization Pre-opening costs Impairment, closure costs, and asset disposals Total operating expenses Income from operations Interest and other income, net Income before income taxes Provision for income taxes 1,847,916 1,472,060 363,072 760,831 451,552 212.778 11.108 23.094 5,142,411 443,958 14,327 458,285 (108,127) 350,158 1,600,760 1,326.079 347,123 680,031 375,460 201.979 8,546 66.639 4,606,617 258,368 10.068 268,436 (91,883) 176,553 Net income Earnings per share: 12.62 Basic Diluted 6.35 6.31 12.38 Weighted average common shares outstanding: Basic Diluted 27,740 28,295 27,823 27,962 CHIPOTLE MEXICAN GRILL, INC. CONSOLIDATED BALANCE SHEETS (in thousands, except per share data) December 31, 2019 2018 $ 249,953 62,312 21,555 54,129 480,626 80,545 26.096 57,076 27,705 400.156 1,072,204 1,458,690 27.855 2,505,466 18,450 21,939 5,104,604 426.845 814,794 1,379.254 30,199 19.332 21,939 2,265,518 $ $ Assets Current assets: Cash and cash equivalents Accounts receivable, net Inventory Prepaid expenses and other current assets Income tax receivable Investments Total current assets Leasehold improvements, property and equipment, net Restricted cash Operating lease assets Other assets Goodwill Total assets Liabilities and shareholders' equity Current liabilities: Accounts payable Accrued payroll and benefits Accrued liabilities Unearned revenue Current operating lease liabilities Income tax payable Total current liabilities Commitments and contingencies (Note 13) Deferred rent Long-term operating lease liabilities Deferred income tax liabilities Other liabilities Total liabilities Shareholders' equity: Preferred stock. $0.01 par value, 600,000 shares authorized, no shares issued as of December 31, 2019 and 2018, respectively Common stock, S0.01 par value, 230,000 shares authorized, 36,323 and 35,973 shares issued as of December 31, 2019 and 2018, respectively Additional paid-in capital Treasury stock, at cost, 8,568 and 8,276 common shares as of December 31, 2019 and 2018, respectively Accumulated other comprehensive loss Retained earnings Total shareholders' equity Total liabilities and shareholders' equity 115,816 126,600 155,843 95,195 173.139 113,071 113,467 147,849 70,474 666,593 5,129 449,990 330,985 2,678,374 37,814 38,797 3,421,578 11,566 31,638 824,179 363 1,465,697 (2,699,119) (5,363) 2,921,448 1,683,026 5,104,604 360 1,374,154 (2,500,556) (6,236) 2,573,617 1,441,339 2,265,518 EXHIBIT 13.16 Financial Statement Analysis Ratios Ratio Formula Measure of Liquidity and Efficiency Current ratio Acid-test ratio Accounts receivable turnover Inventory turnover Current assets Short-term debt-paying ability Current liabilities Cash + Short-term investments + Current receivables Immediate short-term debt- Current liabilities paying ability Net sales Efficiency of collection Average accounts receivable, net Cost of goods sold Efficiency of inventory Average inventory management Accounts receivable, net X 365 Liquidity of receivables Net sales Ending inventory X 365 Liquidity of inventory Cost of goods sold Net sales Efficiency of assets in Average total assets producing sales Days' sales uncollected Days' sales in inventory Total asset turnover Solvency Debt ratio Creditor financing and leverage Owner financing Equity ratio Total liabilities Total assets Total equity Total assets Total liabilities Total equity Income before interest expense and income Interest expense Debt-to-equity ratio Debt versus equity financing Times interest earned Protection in meeting interest payments Profitability Profit margin ratio Gross margin ratio Net income in each sales dollar Gross margin in each sales dollar Overall profitability of assets = Return on total assets Net income Net sales Net sales Cost of goods sold Net sales Net income Average total assets Net income - Preferred dividends Average common stockholders' equity Shareholders' equity applicable to common shares Number of common shares outstanding Net income Preferred dividends Weighted average common shares outstanding Return on common stockholders' equity Book value per common share Profitability of owner investment Liquidation at reported amounts Net income per common share Basic earnings per share Market Prospects Price-earnings ratio Market price per common share Earnings per share Annual cash dividends per share Market price per share Market value relative to earnings Cash return per common share Dividend yield