python 3 please I need the py. code of this project
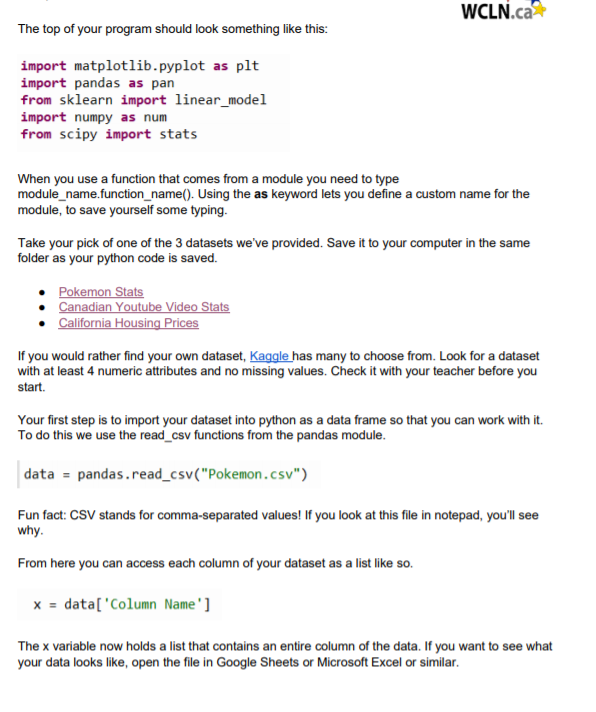
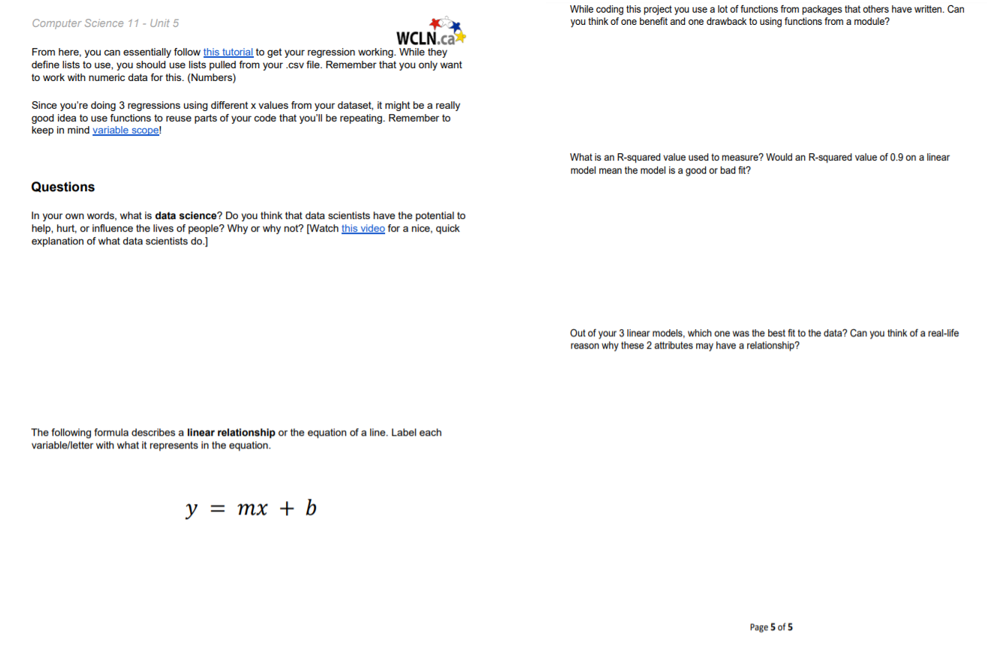
Hints and Resources You are going to need to import a variety of modules to complete this project. Please read the Importing Modules section of 5.2 and ensure you have matplotlib, pandas, sklearn, numpy, and scipy installed in Thonny before beginning to code. WCLN.ca The top of your program should look something like this: import matplotlib.pyplot as plt import pandas as pan from sklearn import linear_model import numpy as num from scipy import stats When you use a function that comes from a module you need to type module_name.function_name(). Using the as keyword lets you define a custom name for the module, to save yourself some typing. Take your pick of one of the 3 datasets we've provided. Save it to your computer in the same folder as your python code is saved. Pokemon Stats Canadian Youtube Video Stats California Housing Prices If you would rather find your own dataset, Kaggle has many to choose from. Look for a dataset with at least 4 numeric attributes and no missing values. Check it with your teacher before you start. Your first step is to import your dataset into python as a data frame so that you can work with it. To do this we use the read_csv functions from the pandas module. data = pandas.read_csv("Pokemon.csv") Fun fact: CSV stands for comma-separated values! If you look at this file in notepad, you'll see why. From here you can access each column of your dataset as a list like so. x = data['Column Name'] The x variable now holds a list that contains an entire column of the data. If you want to see what your data looks like, open the file in Google Sheets or Microsoft Excel or similar. While coding this project you use a lot of functions from packages that others have written. Can you think of one benefit and one drawback to using functions from a module? Computer Science 11 - Unit 5 WCLN.ca From here you can essentially follow this tutorial to get your regression working. While they define lists to use, you should use lists pulled from your csv file. Remember that you only want to work with numeric data for this. (Numbers) Since you're doing 3 regressions using different x values from your dataset, it might be a really good idea to use functions to reuse parts of your code that you'll be repeating. Remember to keep in mind variable scope! What is an R-squared value used to measure? Would an R-squared value of 0.9 on a linear model mean the model is a good or bad fit? Questions In your own words, what is data science? Do you think that data scientists have the potential to help, hurt, or influence the lives of people? Why or why not? [Watch this video for a nice, quick explanation of what data scientists do.] Out of your 3 linear models, which one was the best fit to the data? Can you think of a real-life reason why these 2 attributes may have a relationship? The following formula describes a linear relationship or the equation of a line. Label each variable/letter with what it represents in the equation. y = mx + b Page 5 of 5