

Answered step by step
Verified Expert Solution
Question
1 Approved Answer
Python 3.6 plot question. Use matplotlib and numpy. Consider a ball thrown through the air. If we neglect air resistance, the kinematic equations of the
Python 3.6 plot question. Use matplotlib and numpy.
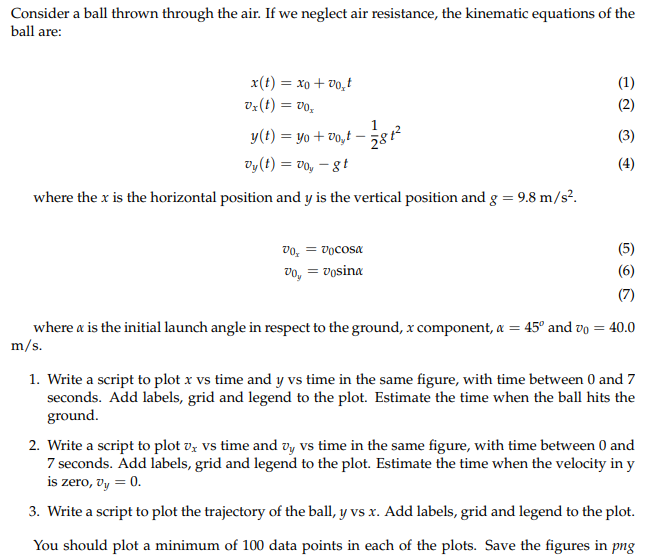
Consider a ball thrown through the air. If we neglect air resistance, the kinematic equations of the ball are: x(t) vo, where the x is the horizontal position and y is the vertical position and g 9.8 m/s? Dosina where a is the initial launch angle in respect to the ground, x component, = 45 and vo m/s. 40.0 1. Write a script to plot x vs time and y vs time in the same figure, with time between 0 and 7 seconds. Add labels, grid and legend to the plot. Estimate the time when the ball hits the ground. 2. Write a script to plot vx vs time and vy vs time in the same figure, with time between 0 and 7 seconds. Add labels, grid and legend to the plot. Estimate the time when the velocity in y 3. Write a script to plot the trajectory of the ball, y vs x. Add labels, grid and legend to the plot. You should plot a minimum of 100 data points in each of the plots. Save the figures in png is zero, Dy 0 Consider a ball thrown through the air. If we neglect air resistance, the kinematic equations of the ball are: x(t) vo, where the x is the horizontal position and y is the vertical position and g 9.8 m/s? Dosina where a is the initial launch angle in respect to the ground, x component, = 45 and vo m/s. 40.0 1. Write a script to plot x vs time and y vs time in the same figure, with time between 0 and 7 seconds. Add labels, grid and legend to the plot. Estimate the time when the ball hits the ground. 2. Write a script to plot vx vs time and vy vs time in the same figure, with time between 0 and 7 seconds. Add labels, grid and legend to the plot. Estimate the time when the velocity in y 3. Write a script to plot the trajectory of the ball, y vs x. Add labels, grid and legend to the plot. You should plot a minimum of 100 data points in each of the plots. Save the figures in png is zero, Dy 0Step by Step Solution
There are 3 Steps involved in it
Step: 1

Get Instant Access to Expert-Tailored Solutions
See step-by-step solutions with expert insights and AI powered tools for academic success
Step: 2

Step: 3
Ace Your Homework with AI
Get the answers you need in no time with our AI-driven, step-by-step assistance
Get Started
Databases On The Web Designing And Programming For Network Access
Authors: Patricia Ju
1st Edition
1558515100, 978-1558515109