Answered step by step
Verified Expert Solution
Question
1 Approved Answer
PYTHON CODE problem: Included my code but could not get the correct exp graph. Plot the Taylor series up to a finite number of terms,
PYTHON CODE problem: Included my code but could not get the correct exp graph.
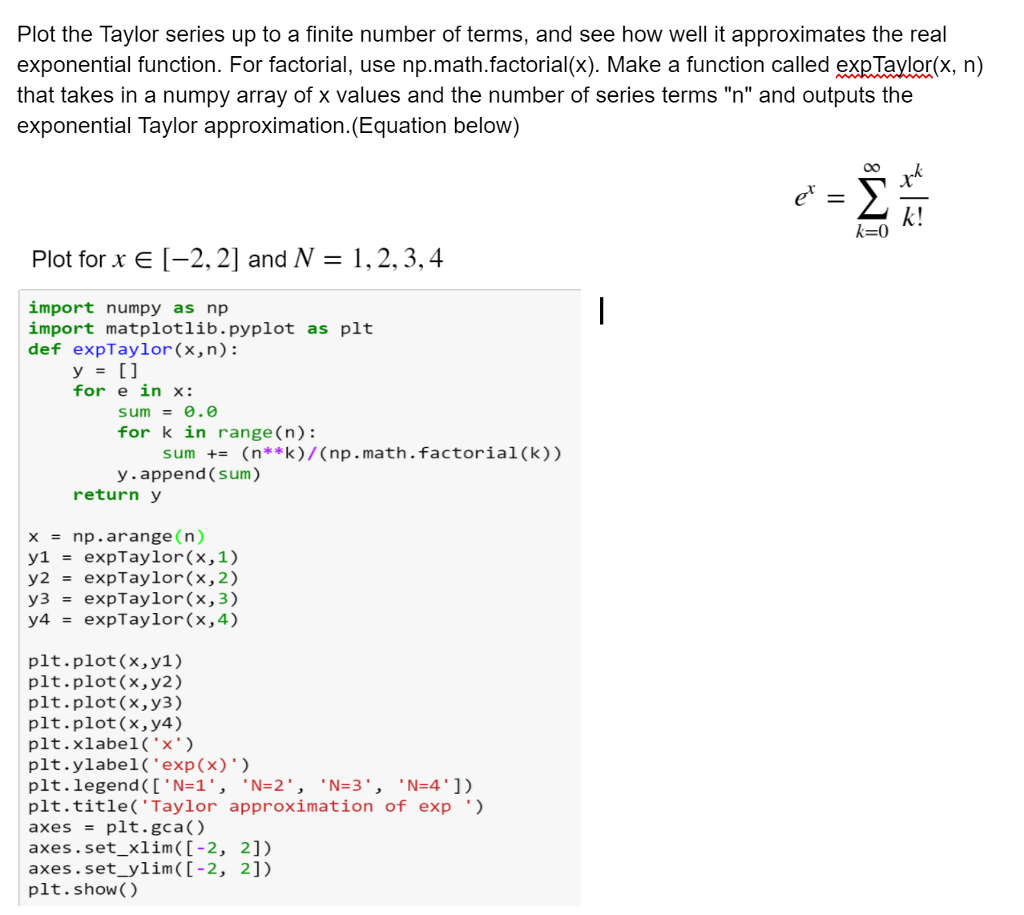
Plot the Taylor series up to a finite number of terms, and see how well it approximates the real exponential function. For factorial, use np.math.factorial(x). Make a function called expTaylor(x, n) that takes in a numpy array of x values and the number of series terms "n" and outputs the exponential Taylor approximation. (Equation below) 0o k! k-0 Plot for x E 1-2, 21 and N = 1 , 2, 3, 4 import numpy as np import matplotlib.pyplot as plt def expTaylor(x,n): for e in x: sum = 0 . 0 for k in range (n) sum += (n**k)/(np.math.factorial(k)) y.append (sum) return y x = np.arange (n) y1expTaylor(x,1) y2expTaylor(x,2) y3 expTaylor(X, 3) y4 = expTaylor(x,4) plt.plot(x,y1) plt.plot(x, y2) plt.plot(x, y3) plt.plot(x, y4) plt . xlabel (x) plt.ylabel( exp(x) ') plt.title('Taylor approximation of exp') axes plt.gca() axes.set_xlim([-2, 2]) axes.set_ylim(I-2, 2]) plt.show()Step by Step Solution
There are 3 Steps involved in it
Step: 1
Get Instant Access to Expert-Tailored Solutions
See step-by-step solutions with expert insights and AI powered tools for academic success
Step: 2
Step: 3
Ace Your Homework with AI
Get the answers you need in no time with our AI-driven, step-by-step assistance
Get Started