Answered step by step
Verified Expert Solution
Question
1 Approved Answer
python coding help with exercise 2. Example 2 incuded with instructions. File Edin View Insert Cal Kome Wat Hela Python 30 Run C MI Binomial
python coding 


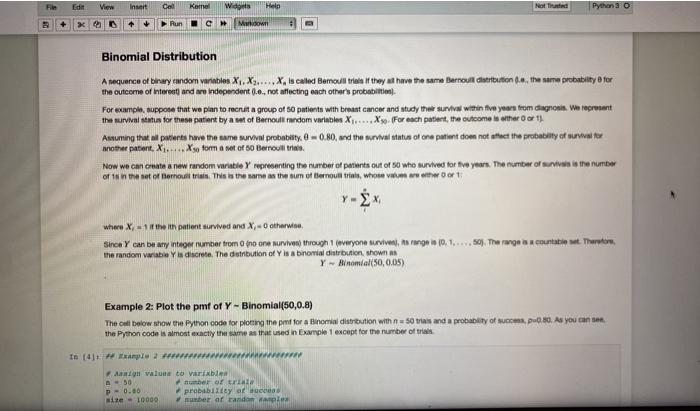
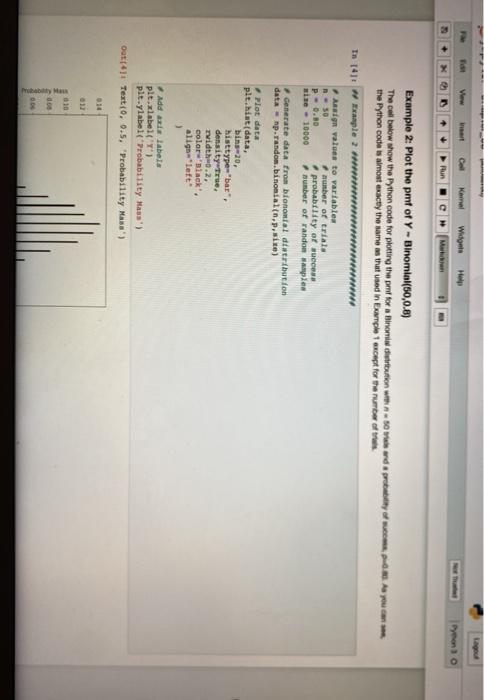
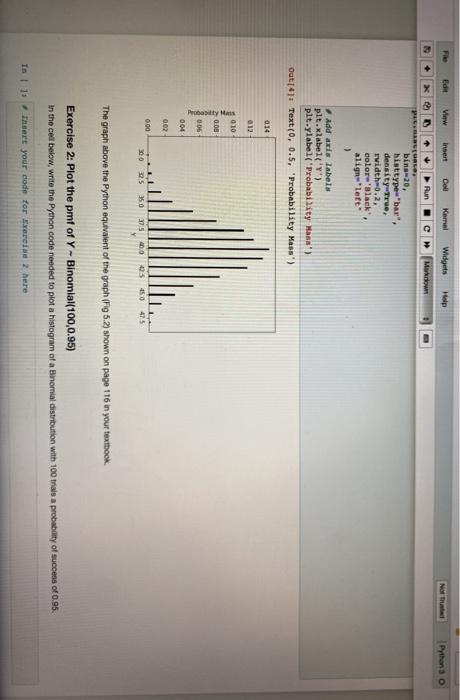
File Edin View Insert Cal Kome Wat Hela Python 30 Run C MI Binomial Distribution A nequence of binary candom vannbiles X. X....X, la calent Bemowl trata i thay at have the same Bernoul dintreusten an. The same probability for the outcome of interest and are independent ... not affecting each other's probabilities For example, suppose that we plan to recruit a group of 50 patients with breast cancer and study the survival within five years from diagnosis. We represent the survival status for the patient by a set of Bernoull random variables X..., X. For each patient, the outcome amar oor 13 Assuming the parents have the same survival probability 0-0.80, and the survival status of one patient to not affect the probability of survival or another patient, X..... Xso form a set of 50 Berrouill tries Now we can create a new random variable Y representing the number of parents out of so who survived for five years. The number of survival is the number of 1 set of mour. This is the same as the sum of Bernoultras, whose wort: where X-1 in patient survived and X, otherwise, Since can be an integer number from no one surven though everyone survival, na rage is 10.1.... 80). There a countatietherworm the random ble Y is discrete. The distribution of Y is a binomial distrbution shown as Y - Binomial(50,0.05) Example 2: Plot the pmf of Y - Binomial(50,0.6) The cell below show the Python code for plotting the part for a Binomial distribution with strain and a probability of sucom. p0.30. As you can the Python code is almost exactly the same as that used in Example 1 except for the number of tra In 14 al 2 min value to variable - 50 umber of tra P0.00 probability of Bize -10000 number of random Verw insert Kanal Widget Help Pyeono Run Example 2: Plot the pit of Y - Binomial(50,0.8) The col below show the Python code for plotting the print for a Birom dirbution within and probably of c. You can the Python code is almost exactly the same as that used in Example 1 Exnet for the number of In 1411 w Hample 2 mm Ansign value to variables - 50 number of trials P=0.30 . probability of wees size - 10000 number of random samples Generate data from bononial distribution data = np.random.binomial(n.P.it) Plot data plt.histdata, bin-20, histtype "bar" density true. width-0.2, color Black aliga "left" Add axis labels plt.label('Y') plt.ylabel('Probability Mass) Out1411 Text{0, 0.5, "Probability Mass) 010 View Insert Cell Kernel Widgets Help Python 3 O Mark Run P bina 20. histtype"bar", density True, rvidth 0.2, color lack'. alignleft ) Add axis labels plt.xlabel('') plt.ylabel( 'Probability Man') Out 4Text(0, 0.5, "Probability Mass) 0.14 012 010 0.05 Perbaru 806 004 0.02 0.00 20 25 30275 400 05 450 475 The graph above the Python equivalent of the graph (F05.2) shown on page 116 in your textbook Exercise 2: Plot the pmf of Y - Binomial(100,0.95) In the cell below, writo the Python code needed to plot a histogram of a Binomial distribution with 100 trials a probability of success of 0.95. TAI 1: Theert your code for Exercise 2 here help with exercise 2. Example 2 incuded with instructions.


Step by Step Solution
There are 3 Steps involved in it
Step: 1

Get Instant Access to Expert-Tailored Solutions
See step-by-step solutions with expert insights and AI powered tools for academic success
Step: 2

Step: 3

Ace Your Homework with AI
Get the answers you need in no time with our AI-driven, step-by-step assistance
Get Started


