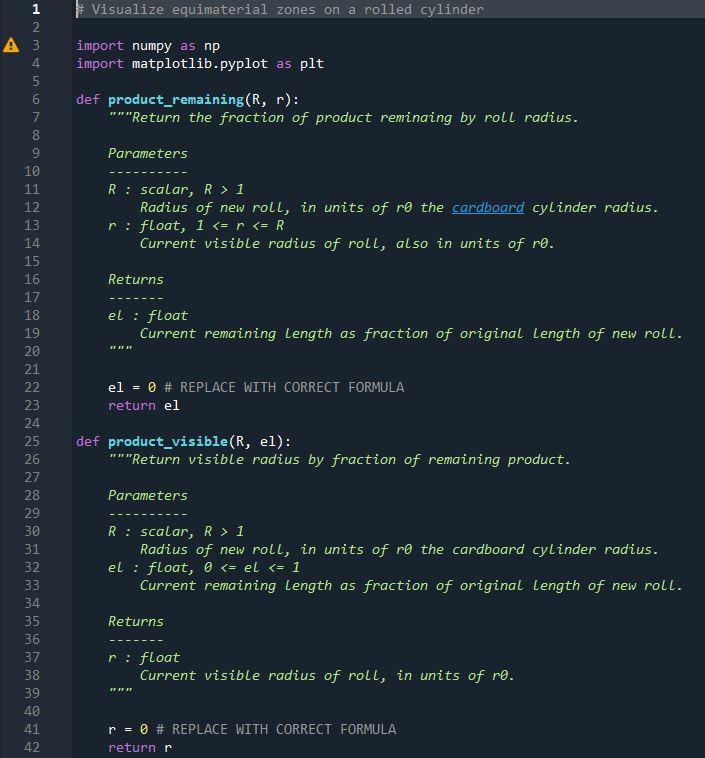
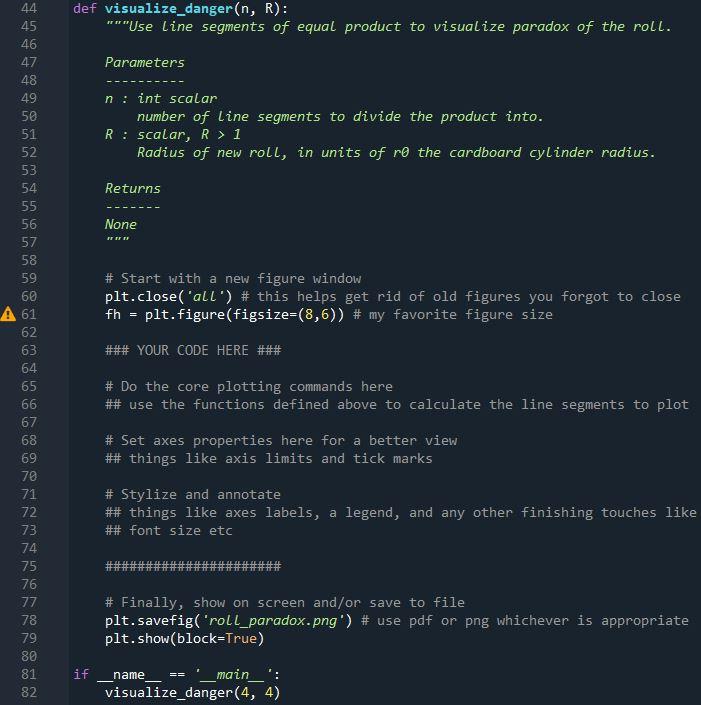
Python help please. I believe I understand the concept but have no idea how to write this program. The prompt has to do with the scaling of the amount of toilet paper compared to an increasing radius. I included my skeleton of the code so you don't have to start from scratch and can just edit it. Pasting text is okay because I can manually enter into the skeleton program.


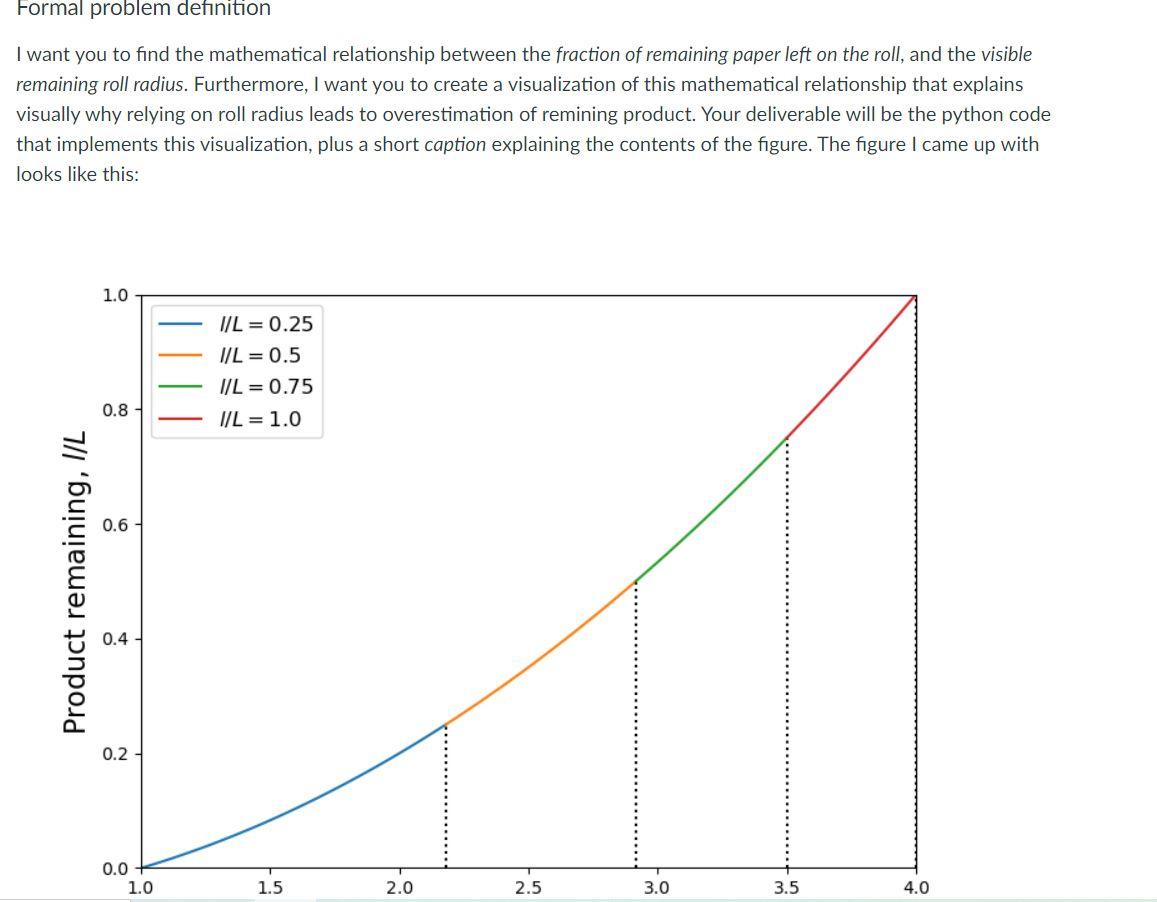
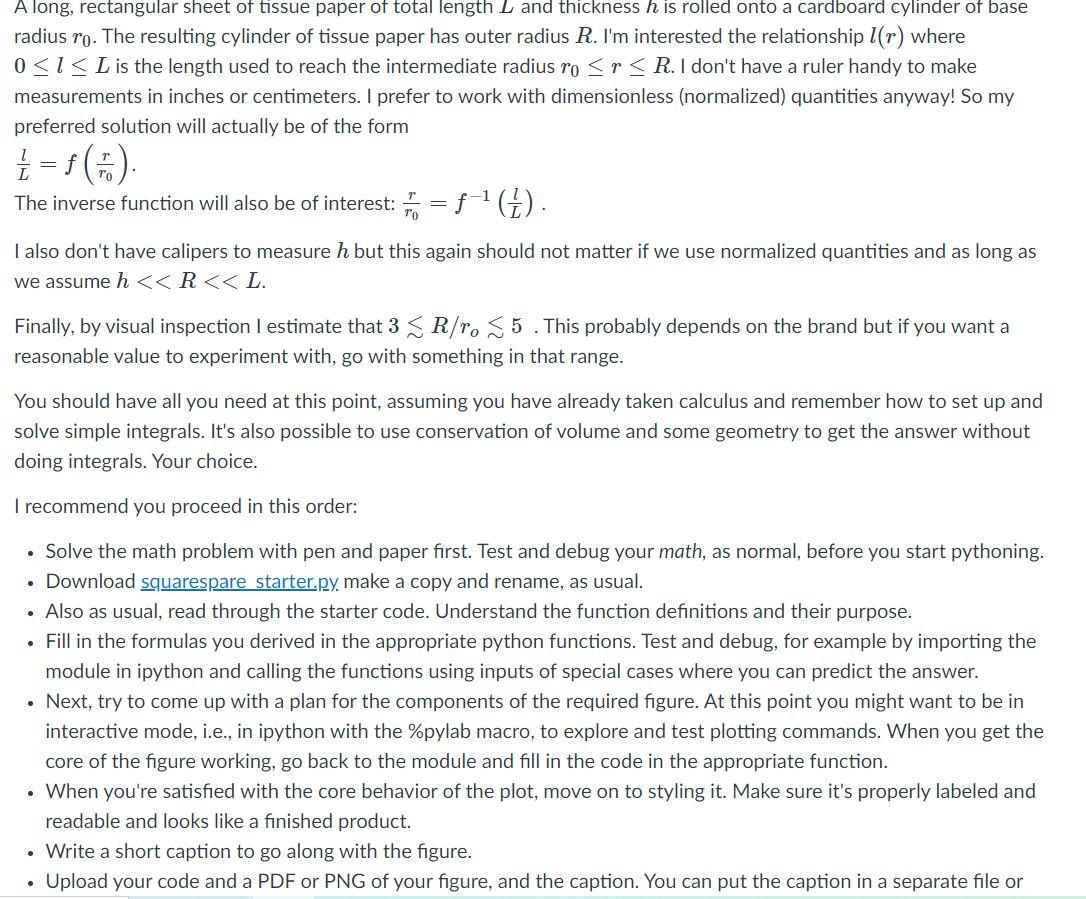
Formal problem definition I want you to find the mathematical relationship between the fraction of remaining paper left on the roll, and the visible remaining roll radius. Furthermore, I want you to create a visualization of this mathematical relationship that explains visually why relying on roll radius leads to overestimation of remining product. Your deliverable will be the python code that implements this visualization, plus a short caption explaining the contents of the figure. The figure I came up with looks like this: 1.0 IL = 0.25 I/L = 0.5 I/L = 0.75 IL = 1.0 0.8 Product remaining, I/L 0.4 0.2 0.0 1.0 1.5 2.0 2.5 3.0 3.5 4.0 A long, rectangular sheet of tissue paper of total length L and thickness his rolled onto a cardboard cylinder of base radius ro. The resulting cylinder of tissue paper has outer radius R. I'm interested the relationship 1(r) where 0
1 Radius of new roll, in units of ro the cardboard cylinder radius. r: float, 1 1 Radius of new roll, in units of ro the cardboard cylinder radius. el : float, 0 1 Radius of new roll, in units of re the cardboard cylinder radius. Returns None # Start with a new figure window plt.close('all') # this helps get rid of old figures you forgot to close fh plt.figure(figsize=(8,6)) # my favorite figure size = 44 45 46 47 48 49 50 51 52 53 54 55 56 57 58 59 60 A 61 62 63 64 65 66 67 68 69 70 71 72 73 74 75 76 77 78 79 80 81 82 ### YOUR CODE HERE ### # Do the core plotting commands here ## use the functions defined above to calculate the line segments to plot # Set axes properties here for a better view ## things like axis limits and tick marks # Stylize and annotate ## things like axes labels, a legend, and any other finishing touches like ## font size etc # Finally, show on screen and/or save to file plt.savefig('roll_paradox.png') # use pdf or png whichever is appropriate plt.show(block=True) if == name _main__': visualize_danger(4, 4) Formal problem definition I want you to find the mathematical relationship between the fraction of remaining paper left on the roll, and the visible remaining roll radius. Furthermore, I want you to create a visualization of this mathematical relationship that explains visually why relying on roll radius leads to overestimation of remining product. Your deliverable will be the python code that implements this visualization, plus a short caption explaining the contents of the figure. The figure I came up with looks like this: 1.0 IL = 0.25 I/L = 0.5 I/L = 0.75 IL = 1.0 0.8 Product remaining, I/L 0.4 0.2 0.0 1.0 1.5 2.0 2.5 3.0 3.5 4.0 A long, rectangular sheet of tissue paper of total length L and thickness his rolled onto a cardboard cylinder of base radius ro. The resulting cylinder of tissue paper has outer radius R. I'm interested the relationship 1(r) where 0 1 Radius of new roll, in units of ro the cardboard cylinder radius. r: float, 1 1 Radius of new roll, in units of ro the cardboard cylinder radius. el : float, 0 1 Radius of new roll, in units of re the cardboard cylinder radius. Returns None # Start with a new figure window plt.close('all') # this helps get rid of old figures you forgot to close fh plt.figure(figsize=(8,6)) # my favorite figure size = 44 45 46 47 48 49 50 51 52 53 54 55 56 57 58 59 60 A 61 62 63 64 65 66 67 68 69 70 71 72 73 74 75 76 77 78 79 80 81 82 ### YOUR CODE HERE ### # Do the core plotting commands here ## use the functions defined above to calculate the line segments to plot # Set axes properties here for a better view ## things like axis limits and tick marks # Stylize and annotate ## things like axes labels, a legend, and any other finishing touches like ## font size etc # Finally, show on screen and/or save to file plt.savefig('roll_paradox.png') # use pdf or png whichever is appropriate plt.show(block=True) if == name _main__': visualize_danger(4, 4)


