Answered step by step
Verified Expert Solution
Question
1 Approved Answer
Python help please. i need help writing a function to compute golub score. i have to compute this using only numpy functions, NO for loops.
Python help please. i need help writing a function to compute golub score. i have to compute this using only numpy functions, NO for loops. ive read in the data, and sperated the matrix into a vector and a matrix that will be taken by the function as parameters. i need help with the golub score using numpy. 


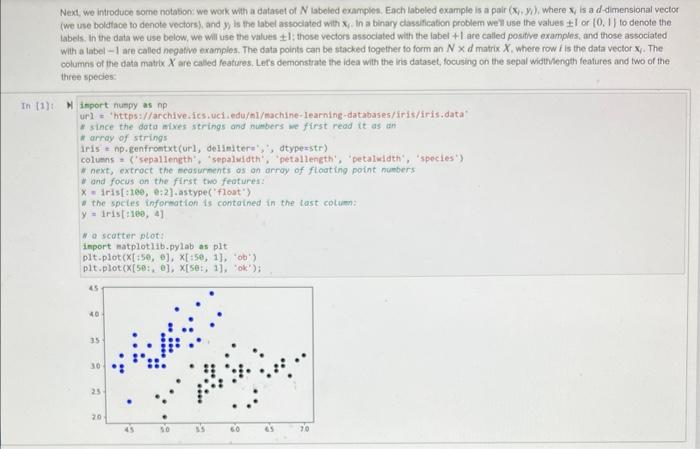
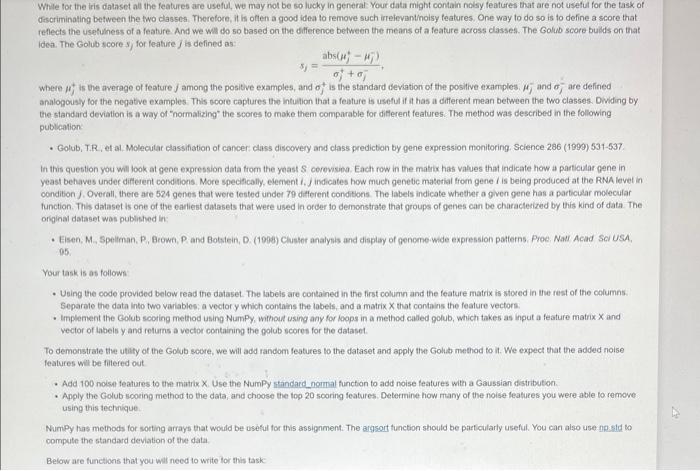
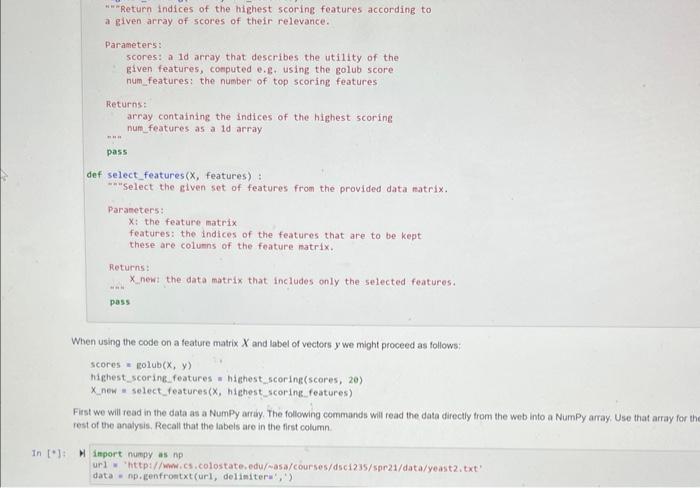
Next, we introduce some notabon: we woek with a datacet of N labeied exampies. Each labeled example is a pair ( xy,y ), where xj is a d-dimensional vector (we use boldtace to denote vectors), and y is the label astociated with xy. In a binary classification problem well use the values I or (0, If to denote the Labels, In the data we use below, we will use the values 1; those veclors associated with the label +1 are called positive examples, and those associated with a label 1 are called negativo exampies. The data points can be stacked together to form an Nd matrix X. where row i is the data vector xy. The columns of the dati matrix X are called featiues, Lets demonstrate the idea with the iris dataset, focusing on the sepal widinlength features and two of the three species: H inport numpy as np url = "https://archive.ics.uci.edul/eachine-learning-databases/inis/iris.data" r since the data mixes strings and numbers we first read it as an. * array of strings Ifis e np. genfrontxt (url, delinitera*; , atyperstr) coluanis = ('sepallength", "sepaluidth", "petallength', "petalidath", "spocles') i. next, extroct the teasurnents as an array of floating point numbers y and focus on the first two feoturea: x=1ris[+169, e:2]-astype("float") * the spctes infortation is contained in the last cotuen: y=1+1s[t1e0,4] W a scatter plot: inport matplotlib.pylab as plt plt.plot (x[+50,6],x[+50,1],+ob) plt.plot (x[50:,e],x[50;,1], oks? ); While tor the iris dataset all the features are useful, we may not be so lucky in general Your data might contain nolsy features that are not usefut for the task of descriminating between the two dlasses. Therefore, it is offen a good idea to remove such irelevantinoisy features. One way to do so is to define a score that reflects the usetuhess of a feature And we will do 50 based on the difference between the means of a feature across classes. The Golub score buids on that idea. The Golub score sj for feature j is defined as: sj=j++jabs(j+j) Where j+is the average of feature j among the positive examples, and j+is the standard deviation of the posilive examples. jand jare defined analopously for the negative examples. This ocore captures the intulion that a feature is usenut if it has a different mean between the two classes. Dwiding by the standard deviation is a way of "normatizing" the scores to make them comparable for diflerent features. The method was described in the following publeation- - Golub, T.R, ef al. Molecutar classifiation of cancer class disoovery and class prediction by gene expression monitoring. Science 2.86 (1999) 531537. In this question you will look at gene expression data from the yoast S coroviog. Each row in the matrix has values that indicate how a particular gene in yeast behaves under different conditions. Nore specifically, elenvent i, J indicates how much genetic matetial from gene I is being produced at the RNA levet in oondition f. Overall, there are 524 genes that were tested under 79 ditterent conditons. The labels indicate whether a given gene has a particular molecular function. This dataset is one of the earliest datasets that were used in order to demonstrate that groups of genes can be characterized by this kind of data. The original dataset wos published lin - Eisen. M. Speltman. P. Brown, P.and Botstein, D. (1008) Clustor analynis and displiny of gencene-wide expression patterns. Proe. Naif Acad Soi USA, 05 Your task is as follows - Using the code previded below read the dataset. The tabels are contained in the first column and the feature matrix is stored in the rest of the columns. Separate the data into two variables; a vector y which contains the labels, and a matrix x that contains the feature vectors: - Implement the Golub scoting method using NumPy, without using any for ioops in a method called polub, which takes as input a feature matrix x and. vector of labeis y and returns a vecior containing the golub scores for the dataset. To demonstrate the utaty of the Golub score, we will add random features lo the dataset and apply the Golut miethod to it. We expect that the added noise features will be filiered out - Add.100 noise features to the matrix X Use the NumPy standacd nommal function to add noise features with a Gaussian distribution. - Apply the Golub sooeing method to the data, and choose the tog 20 sooring features. Determine how many of the noise features you were able to remowe using this technique Numpy has methods for sorting arrays that would be useful for this assignment. The argsort function stiouid be particularly useful. You can also use nesid to compute the standard deviation of the data. Below are functions that wou wal need to write lor this task: def golub(x,y)= ????? ? "ncompute the golub score. Parameters: X: the feature data natrix y : the labels associated with x y is a vector whose length equals the nueber of rows of x. Returns: scores: a vector mose leneth equals the number of coluens of x,,fi.e.. Ten(scores) ac len (xf(e)) pass a given array of scores of their relevance. Parameters: scores: a 1d array that describes the utility of the given features, conputed e.g. using the golub score num_features: the number of top scoring features Returns: array containing the indices of the highest scoring num_features as a 1d array pass def select_features ( X, features) : -inselect the given set of features from the provided data natrix. Parameters: x : the feature matrix features: the indices of the features that are to be kept these are colums of the feature patrix. Returns: X new: the data matrix that includes only the selected features. pass When using the code on a feature matrix X and label of vectors y we might proceed as follows: scores = golub (x,y) highest scoring._. features = highest_scoring(scores, 20) \( X_{\text {_new }}= \) select_features (x, hiehest_scoring__features) First we will read in the data as a Numpy arriy. The following commands will read the data directly trom the web into a NumPy array, Use that array for rest of the analysis. Recall that the labels are in the first column M Inport numpy as np ur1 = 'http://mmi,cs, colostate.edu/ a5a/courses/dsc1235/spe21/data/yeast2,txt ' data = np.genfrontxt (url, deliniteri',') In ["]: H = first step: separate the dato matrix into the feature matrix and labeis * vector; the Labels are in the first cotumn of the data matrix that you * just read y=data.11oc[:,0]x=data.1oc[:,1:] In [5]: M \# add 100 noise features to the dato matrix, 1.e. add 109 cotimns In [6]: A N determine the top 2 features acconding to the golub score In [7]: M \# write code that checks if feature selection was successful: * determine how nany of the noise feotures were removed 


Step by Step Solution
There are 3 Steps involved in it
Step: 1

Get Instant Access to Expert-Tailored Solutions
See step-by-step solutions with expert insights and AI powered tools for academic success
Step: 2

Step: 3

Ace Your Homework with AI
Get the answers you need in no time with our AI-driven, step-by-step assistance
Get Started


