Question
# Python How can I transfer the data frame(in the picture) into another data frame, which includes a column for every 20 th trading day,
# Python
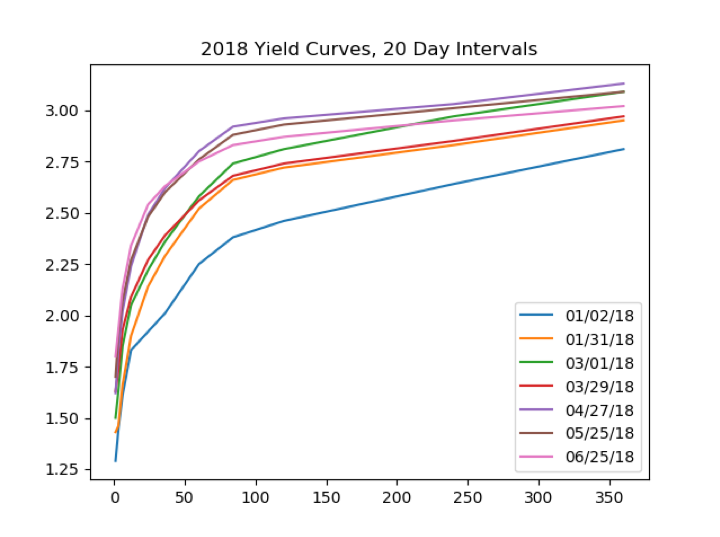
How can I transfer the data frame(in the picture) into another data frame, which includes a column for every 20th trading day, that is, day 0, day 20, day 40, , day 120. The column labels should be 01/02/18, 01/31/18, , 06/25/28, and modify the row labels from 1 mo, 3 mo, and so forth, to the corresponding integer number of months1, 3, , 360
I only screenshot a part of my original data frame:

Finally, I want to make the plot looks like this:

Edit: Following is my code,
from urllib.request import urlopen # b_soup_1.py from bs4 import BeautifulSoup import numpy as np import matplotlib.pyplot as plt from mpl_toolkits.mplot3d import Axes3D from matplotlib import cm from matplotlib.ticker import LinearLocator, FormatStrFormatter
# Treasury Yield Curve web site, known to be HTML code html = urlopen('https://www.treasury.gov/resource-center/' 'data-chart-center/interest-rates/Pages/' 'TextView.aspx?data=yieldYear&year=2018')
# create the BeautifulSoup object (BeautifulSoup Yield Curve) bsyc = BeautifulSoup(html.read(), "lxml")
# save it to a file that we can edit fout = open('daily_yield_curves.txt', 'wt', encoding='utf-8')
# so get a list of all table tags
table_list = bsyc.findAll('table')
# to findAll as a dictionary attribute tc_table_list = bsyc.findAll('table', { "class" : "t-chart" } )
# only 1 t-chart table, so grab it tc_table = tc_table_list[0] # what are this table's components/children? # tag tr means table row, containing table data # what are the children of those rows? # we have found the table data! # just get the contents of each cell
daily_yield_curves_temp = [] daily_yield_curves = [] for c in tc_table.children: for r in c.children: for i in r.contents: daily_yield_curves_temp.append(i)
for x in range(len(daily_yield_curves_temp) // 12): daily_yield_curves.append(daily_yield_curves_temp[12 * x : 12 * x + 12])
for y in daily_yield_curves: for z in y: fout.write(z) fout.write(" ") fout.write(" ")
for i in range(1, len(daily_yield_curves_temp) // 12): for j in range(1,12): daily_yield_curves[i][j] = float(daily_yield_curves[i][j])
print(' the contents of the children of the t-chart table:') for j in daily_yield_curves: print("\t ",j,", ")
# the contents of each cell is a list of one # string -- we can work with those!
fout.close()
fig = plt.figure() ax = fig.gca(projection='3d')
cn_to_nm = {'1 mo' : 1, '3 mo' : 3, '6 mo' : 6, '1 yr' : 12, \ '2 yr' : 24, '3 yr' : 36, '5 yr' : 60, '7 yr' : 84, \ '10 yr': 120, '20 yr' : 240, '30 yr' : 360} date_data_temp = [] date_data = [] for x in range(len(daily_yield_curves_temp) // 12 - 1): date_data.append([x]) for x in range(len(daily_yield_curves_temp) // 12 - 1): for y in range(10): date_data[x].append(x) X = np.array(date_data)
months_to_maturity_temp = [] months_to_maturity = [] for key in cn_to_nm.values(): months_to_maturity_temp.append(key) for x in range(len(daily_yield_curves_temp) // 12 - 1): months_to_maturity.append(months_to_maturity_temp) Y = np.array(months_to_maturity)
rate_data = [] for x in range(1, len(daily_yield_curves_temp) // 12): rate_data.append(daily_yield_curves[x][1:]) Z = np.array(rate_data)
ax.set_xlim(0, 200) ax.xaxis.set_major_locator(LinearLocator(5))
ax.set_ylim(0, 400) ax.yaxis.set_major_locator(LinearLocator(5))
ax.set_zlim(0, 4) ax.zaxis.set_major_locator(LinearLocator(5)) ax.zaxis.set_major_formatter(FormatStrFormatter('%.02f'))
surf = ax.plot_surface(X, Y, Z, cmap=cm.coolwarm,linewidth=0, antialiased=False)
plt.show()
import pandas as pd headers =daily_yield_curves.pop(0) # gives the headers as list and leaves data yield_curve_df = pd.DataFrame(daily_yield_curves, columns=headers) yield_curve_df.plot()
Date 1 mo 3 mo 6 mo 1yr 2 yr 3 yr 5yr 7yr 10 yr 20 yr 30 yr 0 01/02/18 1.29 1.44 1.61 1.83 1.922.01 2.25 2.38 2.46 2.642.81 1 01/03/18 1.29 1.41 1.59 1.81 1.94 2.02 2.25 2.37 2.44 2.62 2.78 2 01/04/18 1.28 1.41 1.60 1.82 1.96 2.05 2.27 2.38 2.462.62 2.79 3 01/05/18 1.27 1.39 1.58 1.80 1.96 2.06 2.29 2.40 2.47 2.64 2.81 4 01/08/18 1.30 1.45 1.60 1.79 1.962.07 2.29 2.41 2.49 2.65 2.81 5 01/09/18 1.27 1.44 1.60 1.781.98 2.09 2.33 2.46 2.55 2.72 2.88Step by Step Solution
There are 3 Steps involved in it
Step: 1

Get Instant Access to Expert-Tailored Solutions
See step-by-step solutions with expert insights and AI powered tools for academic success
Step: 2

Step: 3

Ace Your Homework with AI
Get the answers you need in no time with our AI-driven, step-by-step assistance
Get Started


