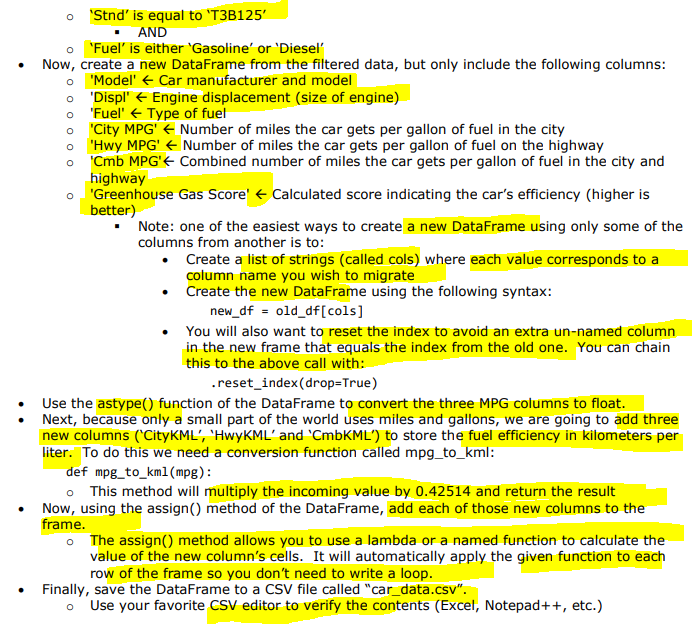
Python - I am stuck/confused with the yellow highlights on this assignment. You can see my attempts below. For instance, with the header being infer, that means header = None? And how do I filter a column in a csv file?!?! I have provided a small sample of the file below. And how do I create a new DataFrame? does this mean create a new function like def? and each value corresponds to a column that I wish to migrate? I don't understand...and multiplying the income by 0.42514 ?!??! are they referring to a parameter? I am so confused. Please help
SCRIPT:
import numpy as np import pandas as pd import matplotlib.pyplot as plt %matplotlib inline # For Jupyter Notebook only
#df = df.SomeFunction() #new_df = df.SomeFunction()
all_alpha = pd.read_csv('C:\\Users\\xxxxx\\Desktop\\Notebook\\all_alpha_19.csv', header = None)
df_filter_row = df_desc_sort[df_desc_sort['Fuel'] = 'Gasoline' OR 'Diesel']
print(df_filter_row())
df_filter_col = df_filter_row[['Stnd'] = 'T3B125']
new_df = old_df[cols] .reset_index(drop=True)
SAMPLE OF THE ALPHA FILE
Model | Displ | Cyl | Trans | Drive | Fuel | Cert Region | Stnd | Stnd Description | Underhood ID | Veh Class | Air Pollution Score | City MPG | Hwy MPG | Cmb MPG | Greenhouse Gas Score | SmartWay | Comb CO2 |
ACURA ILX | 2.4 | 4 | AMS-8 | 2WD | Gasoline | CA | L3ULEV125 | California LEV-III ULEV125 | KHNXV02.4KH3 | small car | 3 | 24 | 34 | 28 | 6 | No | 316 |
ACURA ILX | 2.4 | 4 | AMS-8 | 2WD | Gasoline | FA | T3B125 | Federal Tier 3 Bin 125 | KHNXV02.4KH3 | small car | 3 | 24 | 34 | 28 | 6 | No | 316 |
ACURA MDX | 3 | 6 | AMS-7 | 4WD | Gasoline | CA | L3ULEV125 | California LEV-III ULEV125 | KHNXV03.0AH3 | small SUV | 3 | 26 | 27 | 27 | 6 | No | 330 |
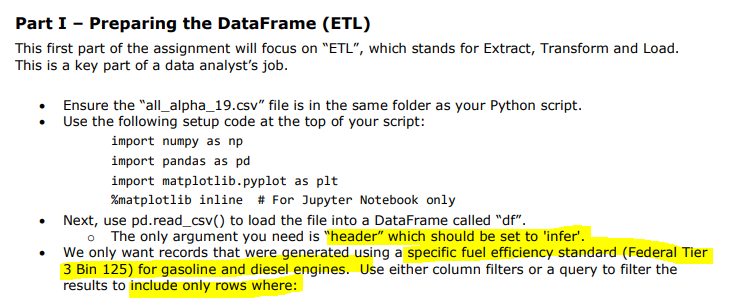
Part I - Preparing the DataFrame (ETL) This first part of the assignment will focus on "ETL", which stands for Extract, Transform and Load. This is a key part of a data analyst's job. Ensure the "all_alpha_19.csv" file is in the same folder as your Python script. Use the following setup code at the top of your script: import numpy as np import pandas as pd import matplotlib.pyplot as plt %matplotlib inline # For Jupyter Notebook only Next, use pd.read_csv) to load the file into a DataFrame called "df". The only argument you need is "header" which should be set to 'infer'. We only want records that were generated using a specific fuel efficiency standard (Federal Tier 3 Bin 125) for gasoline and diesel engines. Use either column filters or a query to filter the results to include only rows where: o o 'Stnd' is equal to 'T3B125 AND o 'Fuel' is either 'Gasoline' or 'Diesel Now, create a new DataFrame from the filtered data, but only include the following columns: o 'Modell + Car manufacturer and model o 'Displ' + Engine displacement (size of engine) o "Fuel Type of fuel o 'City MPG'Number of miles the car gets per gallon of fuel in the city o 'Hwy MPG' Number of miles the car gets per gallon of fuel on the highway 'Cmb MPG' Combined number of miles the car gets per gallon of fuel in the city and highway o 'Greenhouse Gas Score' Calculated score indicating the car's efficiency (higher is better) Note: one of the easiest ways to create a new DataFrame using only some of the columns from another is to: Create a list of strings (called cols) where each value corresponds to a column name you wish to migrate Create the new DataFrame using the following syntax: new_df = old_df [cols] You will also want to reset the index to avoid an extra un-named column in the new frame that equals the index from the old one. You can chain this to the above call with: .reset_index (drop=True) Use the astype() function of the DataFrame to convert the three MPG columns to float. Next, because only a small part of the world uses miles and gallons, we are going to add three new columns (CityKML', 'HwyKML' and 'CmbKML') to store the fuel efficiency in kilometers per liter. To do this we need a conversion function called mpg_to_kml: def mpg_to_km1(mpg): o This method will multiply the incoming value by 0.42514 and return the result Now, using the assign() method of the DataFrame, add each of those new columns to the frame. o The assign() method allows you to use a lambda or a named function to calculate the value of the new column's cells. It will automatically apply the given function to each row of the frame so you don't need to write a loop. Finally, save the DataFrame to a CSV file called "car_data.csv". o Use your favorite CSV editor to verify the contents (Excel, Notepad++, etc.)