Answered step by step
Verified Expert Solution
Link Copied!

Question

1 Approved Answer

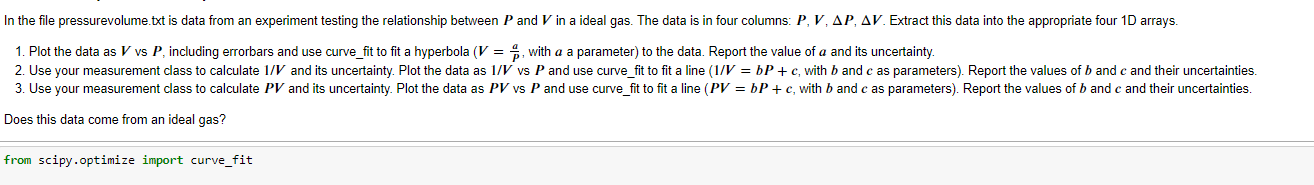
PYTHON JUYPTER NOTEBOOK TASK: In the file pressurevolume.txt is data from an experiment testing the relationship between and V in a ideal gas. The data

PYTHON JUYPTER NOTEBOOK TASK:

image text in transcribed

In the file pressurevolume.txt is data from an experiment testing the relationship between and V in a ideal gas. The data is in four columns: P,V, AP, AV. Extract this data into the appropriate four 1D arrays. 1. Plot the data as V vs P, including errorbars and use curve_fit to fit a hyperbola (V = , with a a parameter) to the data. Report the value of a and its uncertainty. 2. Use your measurement class to calculate 1/V and its uncertainty. Plot the data as 1/V vs P and use curve_fit to fit a line (1/V = bP+c, with b and c as parameters). Report the values of b and c and their uncertainties. 3. Use your measurement class to calculate PV and its uncertainty. Plot the data as PV vs P and use curve_fit to fit a line (PV = bP+c, with b and c as parameters). Report the values of b and c and their uncertainties. Does this data come from an ideal gas? from scipy.optimize import curve_fit In the file pressurevolume.txt is data from an experiment testing the relationship between and V in a ideal gas. The data is in four columns: P,V, AP, AV. Extract this data into the appropriate four 1D arrays. 1. Plot the data as V vs P, including errorbars and use curve_fit to fit a hyperbola (V = , with a a parameter) to the data. Report the value of a and its uncertainty. 2. Use your measurement class to calculate 1/V and its uncertainty. Plot the data as 1/V vs P and use curve_fit to fit a line (1/V = bP+c, with b and c as parameters). Report the values of b and c and their uncertainties. 3. Use your measurement class to calculate PV and its uncertainty. Plot the data as PV vs P and use curve_fit to fit a line (PV = bP+c, with b and c as parameters). Report the values of b and c and their uncertainties. Does this data come from an ideal gas? from scipy.optimize import curve_fit

Step by Step Solution

There are 3 Steps involved in it

Step: 1

blur-text-image

Get Instant Access to Expert-Tailored Solutions

See step-by-step solutions with expert insights and AI powered tools for academic success

Step: 2

blur-text-image

Step: 3

blur-text-image

Ace Your Homework with AI

Get the answers you need in no time with our AI-driven, step-by-step assistance

Get Started

Recommended Textbook for

Pro SQL Server Wait Statistics

Authors: Enrico Van De Laar

1st Edition

1484211391, 9781484211397

More Books

Students also viewed these Databases questions

Question

Why do HCMSs exist? Do they change over time?

Answered: 1 week ago